Table of contents
Key takeaways
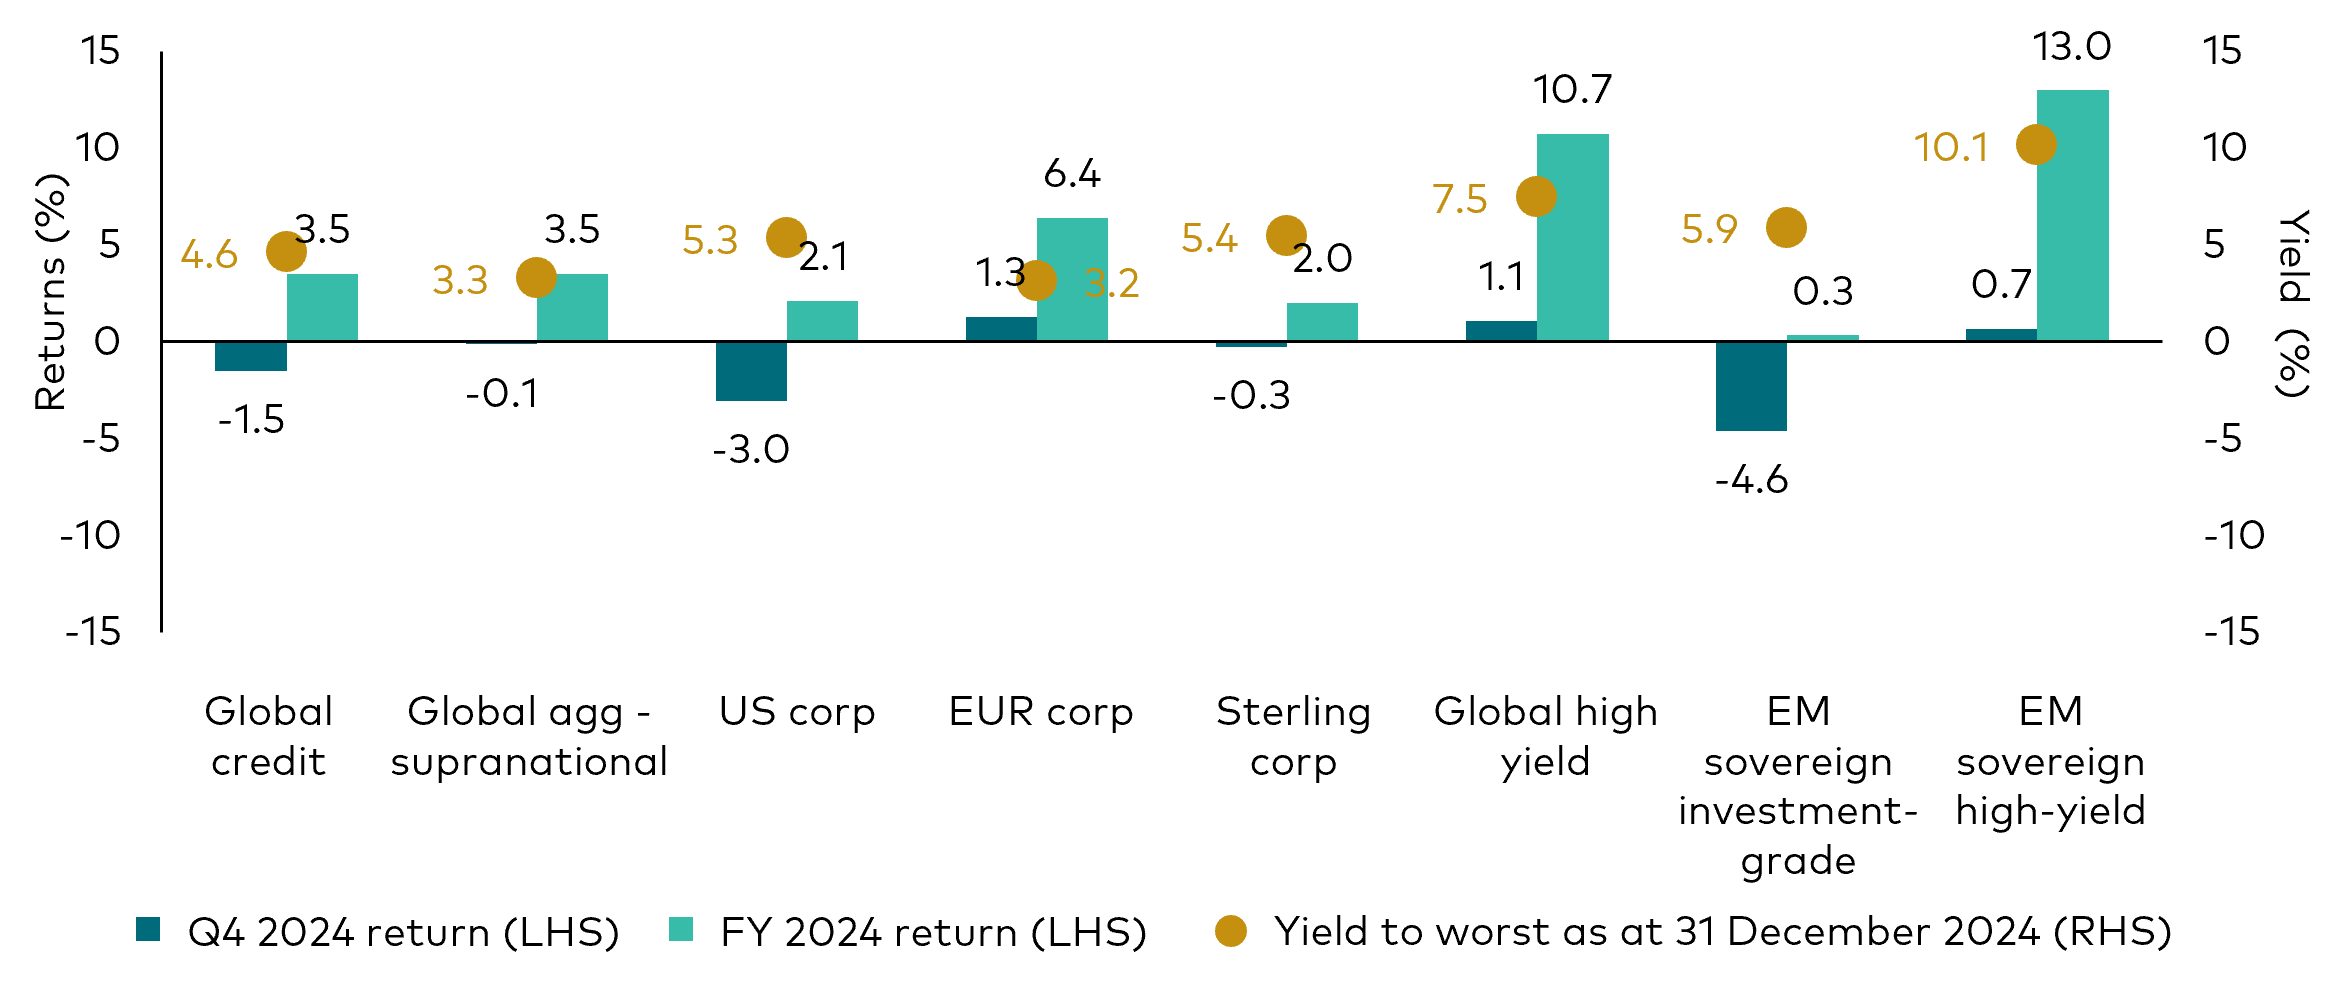
Performance: Higher income returns helped spark positive performance across most bond market sectors in 2024, despite a modest rise in intermediate- and long-term yields. Lower-quality credit segments outperformed, driven by favourable macroeconomic conditions and robust investor demand.
Looking ahead: The overall outlook for bonds in 2025 is notably positive. We anticipate an era where interest rates remain above inflation, helping investors to achieve success in fixed income. Yields are attractive compared with those observed since the 2008 financial crisis. Still, uncertainties underlie the outlook, given potential changes to US immigration and trade policy. Monetary easing is expected to continue in 2025, albeit at a notably slower pace this year in the US than in Europe.
Approach: Evolving macroeconomic conditions will test credit spread valuations that look full relative to historical levels. We favour an opportunistic approach to rates strategies and prefer credit sectors that have lagged recent tightening.
A real deal for investors
We expect a favourable environment for fixed income this year. Attractive starting yields across the curve offer the prospect of durable income, and they can provide a buffer against price volatility, as well as capital appreciation if rates drop.
Bonds are positioned to perform well across a range of scenarios, which makes the case for their role in a portfolio, especially for those investors who hold excess cash. Most bond yields are at parity with, or notably higher than, prevailing money market rates, and bonds offer better diversification properties than cash.
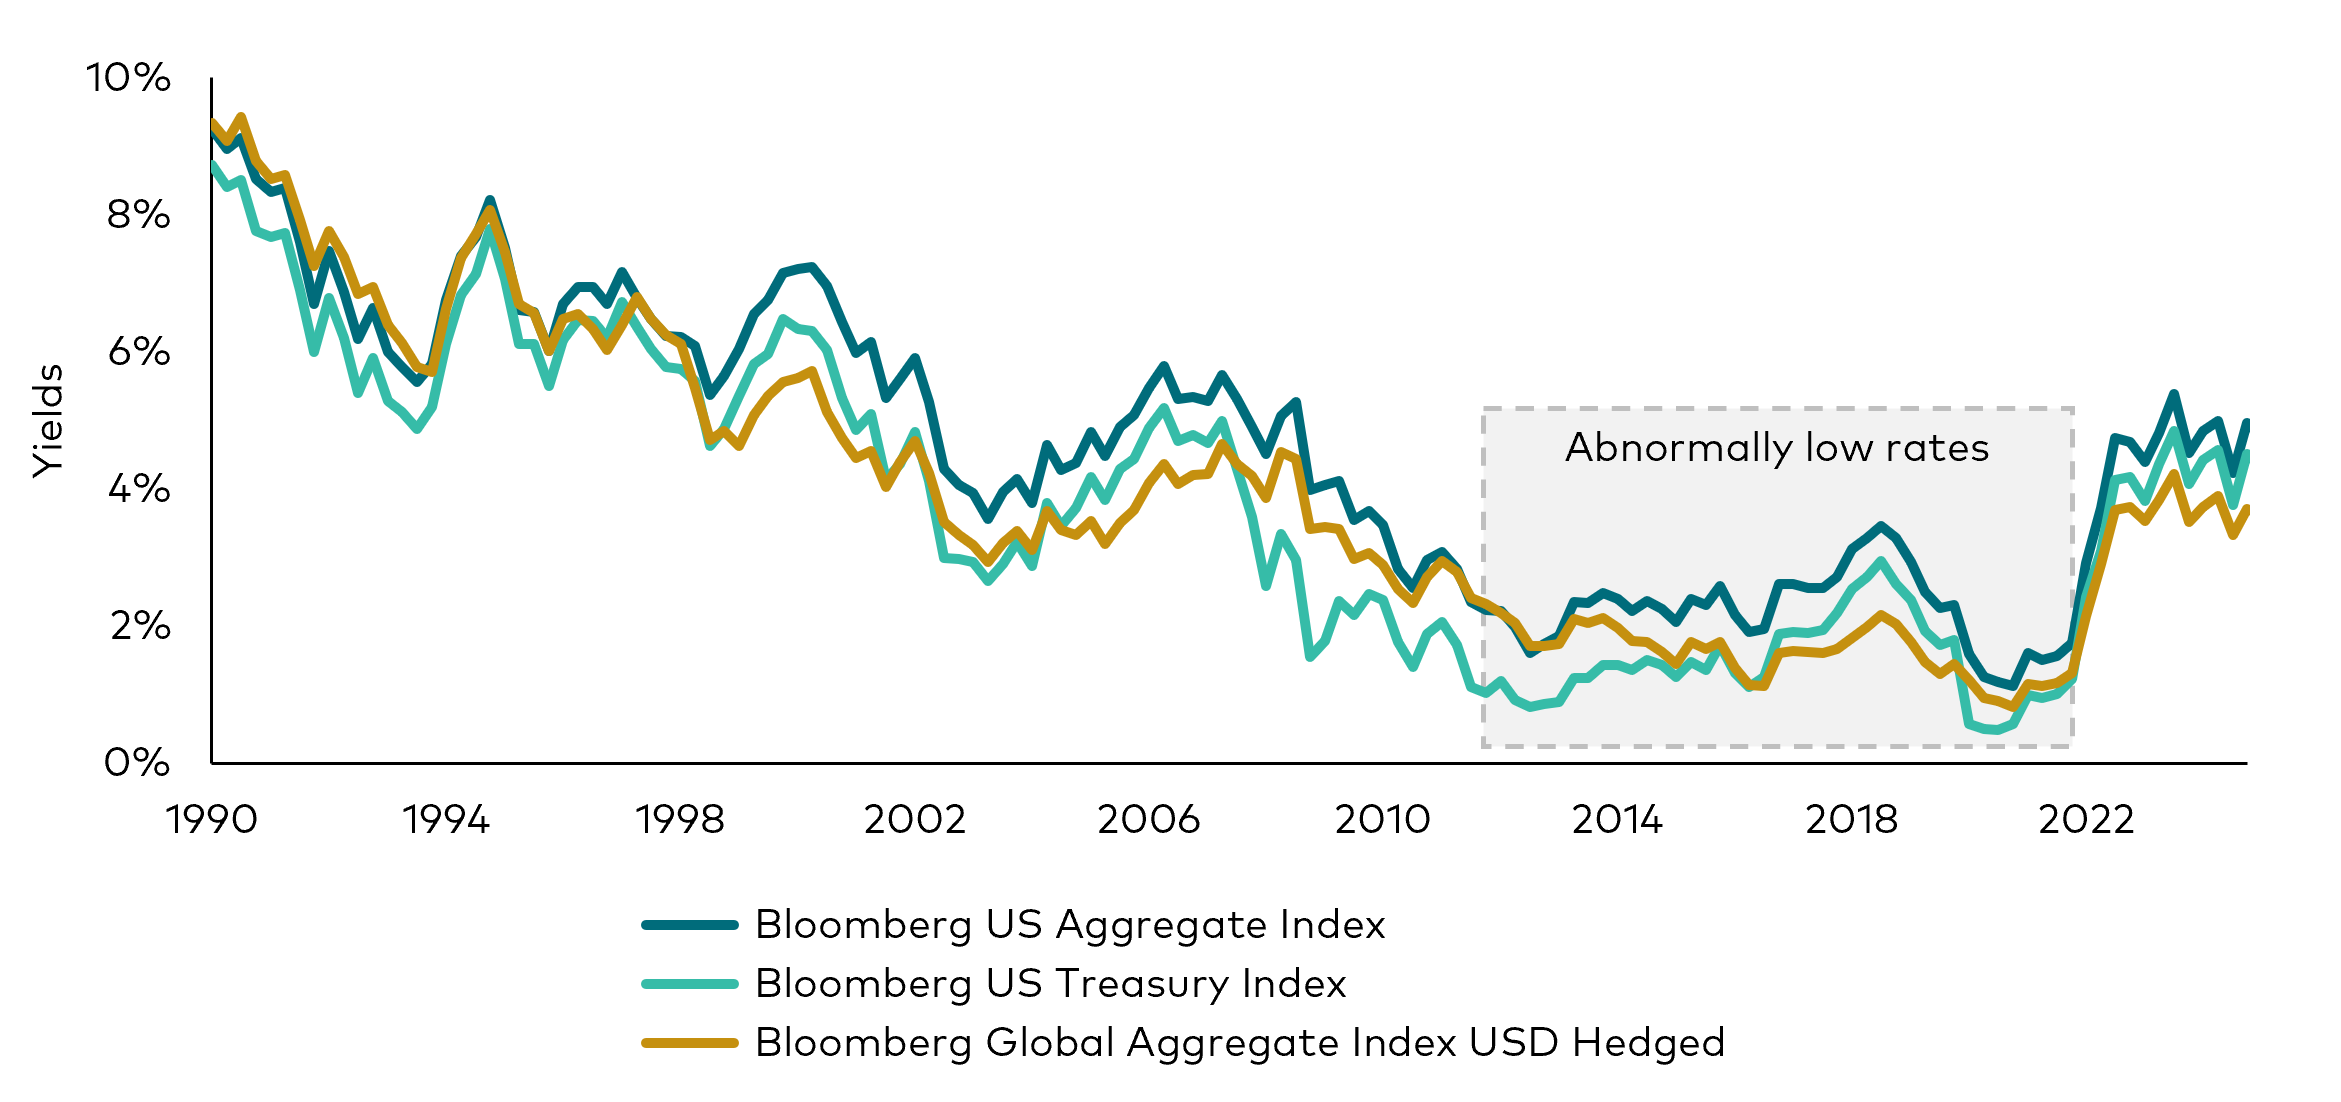
In our economic and market outlook for 2025, we re-emphasised our view that we’ve entered an era of sound money—characterised by positive real interest rates, which provides a foundation for solid fixed income returns over the next decade. Importantly, even though policy rates are generally expected to fall further, we believe they will ultimately settle at higher levels than those observed during the 2010s.
Relative to history, we are back to a more normal regime. Investors should recognise there is a real deal in bonds.
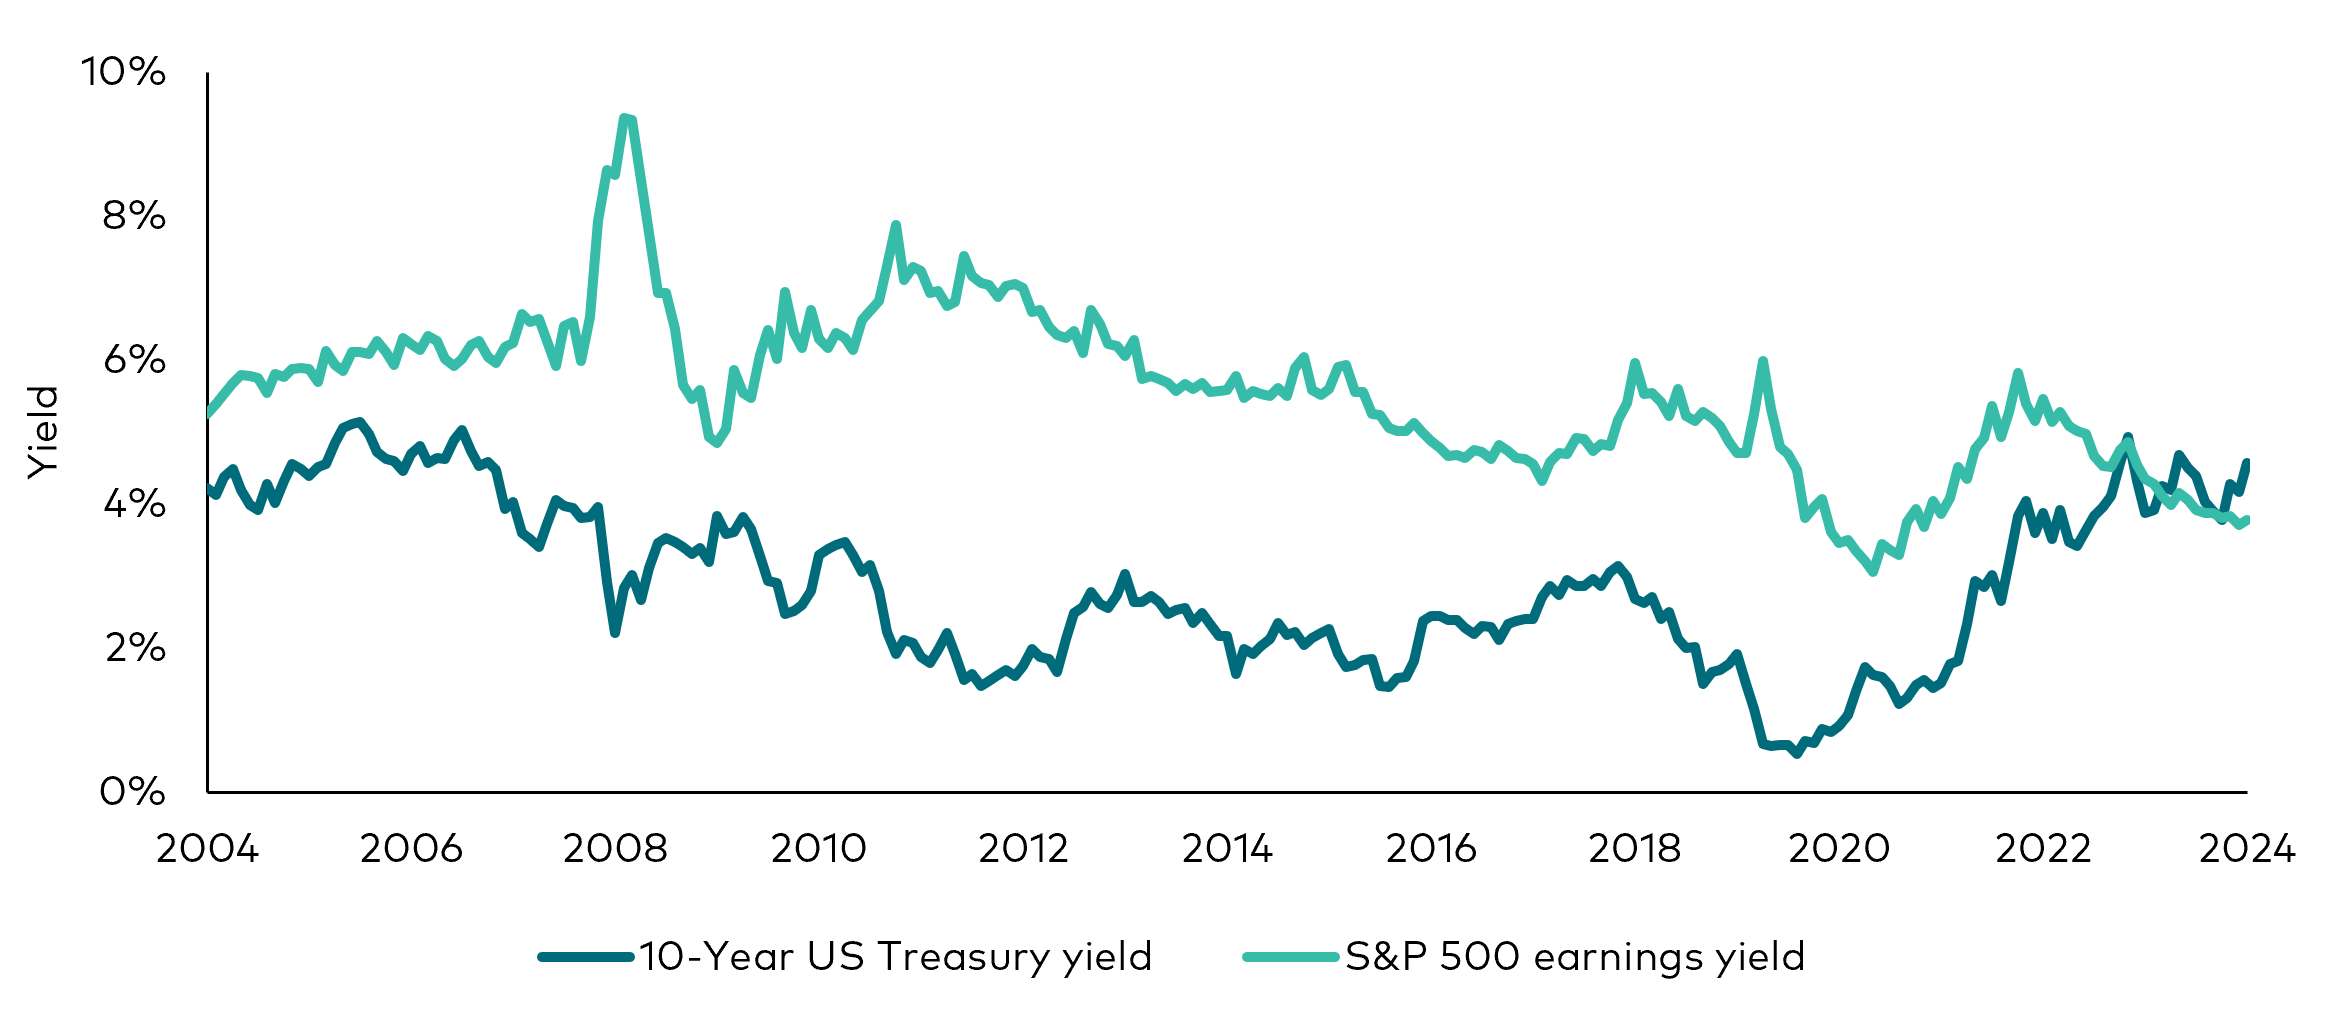
A rare occurrence: The 10-year US Treasury yield is higher than the S&P 500 earnings yield
Past performance is no guarantee of future returns. The performance of an index is not an exact representation of any particular investment, as you cannot invest directly in an index.
Note: The Standard and Poor’s (S&P) 500 Index earnings yield is a weighted average of each constituent stock’s most recent trailing 12-month earnings per share divided by its share price.
Source: Bloomberg, as at 31 December 2024.
Back to normal: Bond yields during the 2010s were an outlier
Past performance is no guarantee of future returns. The performance of an index is not an exact representation of any particular investment, as you cannot invest directly in an index.
Source: Bloomberg, for the period 30 March 1990 to 31 December 2024.
Opportunities and risks
In the US, there is always policy uncertainty when a new administration takes the reins in Washington, D.C., but perhaps even more so now given today’s domestic and global tensions. While our base case outlook for risk assets is positive, we emphasise that the uncertainty created by the incoming US administration creates a broader range of potential outcomes for growth, inflation and monetary policy, both domestically and abroad. This merits a disciplined and nimble approach to risk assets, and portfolio construction considerations that include the need for ballast.
US market performance this year will depend on the development of several key factors:
- Economic momentum. Household and corporate balance sheets are fundamentally healthy, helping to drive the spending that is helping bolster growth and stall disinflation.
- Tariffs. The size and distribution of tariffs could dampen growth while potentially boosting inflation. Geopolitical retaliation could increase business uncertainty and further constrain growth.
- Immigration. Border policy and its implementation could sharply curtail immigration, which would reduce much of the labour supply that has spurred growth recently. That could dampen future growth and raise inflation as businesses compete for workers.
- Fiscal Policy. The net impact of tax and spending decisions could be expansionary and inflationary, which could push yields high enough to tighten financial conditions and ultimately slow the economy down. Risks are higher given the high levels of government debt.
- Deregulation. Depending on how it is implemented, deregulation could spur innovation and productivity, impacting some sectors of the economy more than others.
Depending on how these factors play out, the US Federal Reserve (Fed) will have to guide monetary policy in an environment where there is significant uncertainty about the neutral rate.
With a lot of good news already priced into risk assets, including equities and corporate bond spreads, we continue to take a long-term view and approach the year ahead with patience. Uneven economic environments can produce higher market volatility but can also uncover new opportunities.
Within a framework of disciplined risk management and robust credit research, the dispersion and dislocations can be harnessed and monetised into alpha via security selection.
Fixed income sector returns and yields
Past performance is no guarantee of future returns. The performance of an index is not an exact representation of any particular investment, as you cannot invest directly in an index.
Sources: Bloomberg indices and the J.P. Morgan EMBI Global Diversified Index. Q4 2024 return data from 30 September 2024 to 31 December 2024. FY 2024 return data from 31 December 2023 to 31 December 2024. Performance is provided on a total return basis, in the base currency of the index, or for global indices, USD hedged.
Economy, policy and markets
US market
Market participants were surprised last year by the resilience of the US economy, which powered past the effects of the fastest interest rate-hiking cycle in forty years. Since the Fed stopped raising rates 18 months ago, the US economy has enjoyed strong growth, low unemployment and cooling inflation.
As we detailed in our recent 2025 economic outlook, we attribute these conditions primarily to healthy supply factors, including a surge in productivity and available labour.
We anticipate that the US economy will maintain momentum, but at a slightly slower pace. Emerging policy risks, including the implementation of trade tariffs and stricter immigration rules, could reduce the labour supply and increase inflationary pressures. Our base case forecast is for US GDP growth to remain sound at 2.1%, which accounts for a modest drag from potential changes in trade and immigration policies.
We also expect progress on inflation to stall, driven by increases in shelter and services costs. That will likely keep core inflation measures above the Fed’s 2% target and likely above 2.5% for most of the year.
The decline in inflation from pandemic-era highs has allowed the Fed to deliver 100 basis points (bps) of maintenance cuts so far this cycle, reducing the US policy rate from 5.5% to 4.5%. However, economic growth and persistent above-target inflation should lead to a more gradual path of rate cuts in 2025. Unless growth weakens significantly, we expect the Fed to maintain a cautious approach, keeping the federal funds rate at or above 4%.
Markets and the Fed will need to navigate the uncertainty. We are closely monitoring emerging policy risks, particularly those that could dampen economic growth and exacerbate inflation. These factors may influence the Fed’s decisions on the extent and timing of further policy rate reductions.
International markets
Outside of the US, less favourable supply dynamics and restrictive monetary policies in Europe and elsewhere have translated into weaker economic growth. The course ahead looks uneven and may be impacted by the status of US trade tariff policy. We see the following scenarios playing out across the globe:
- Euro area. Growth is likely to remain below trend in 2025. We expect the European Central Bank (ECB) to cut rates below 2% by the end of the year, which in our view is reflected appropriately in market pricing. The extent and pace of cuts expected by the ECB is greater than that expected by the Fed, but the divergence reflects different economic fundamentals, in our view.
We continue to expect peripheral euro area countries to outperform core countries from an economic perspective, but are highly selective in our positioning, given tighter spreads.
- United Kingdom. Fiscal stimulus measures should support growth. Slowing-but-sticky inflation will likely put the Bank of England on a gradual cutting path and keep policy rates above neutral this year.
The UK attracted headlines in January as the yield curve continued to steepen, raising question marks about government funding and mortgage costs, the strength of the economy and consequently, the potential for a growing deficit. We believe the move is predominantly being driven by technical factors in an environment of abundant new supply in January, rather than a marked economic deterioration since the start of the year.
- Japan. A pickup in domestic demand should propel growth above 1%. We expect the Bank of Japan (BOJ) to continue its gradual hiking cycle as economic activity recovers and inflation momentum holds steady.
- China. Stimulus measures could offer a temporary economic boost, but more comprehensive fiscal and monetary policies will be essential to counter the significant external challenges posed by potential US trade policies, the structural issues in the Chinese property sector and the lack of confidence among households and businesses.
Portfolio positioning and strategy
Rates
US rates
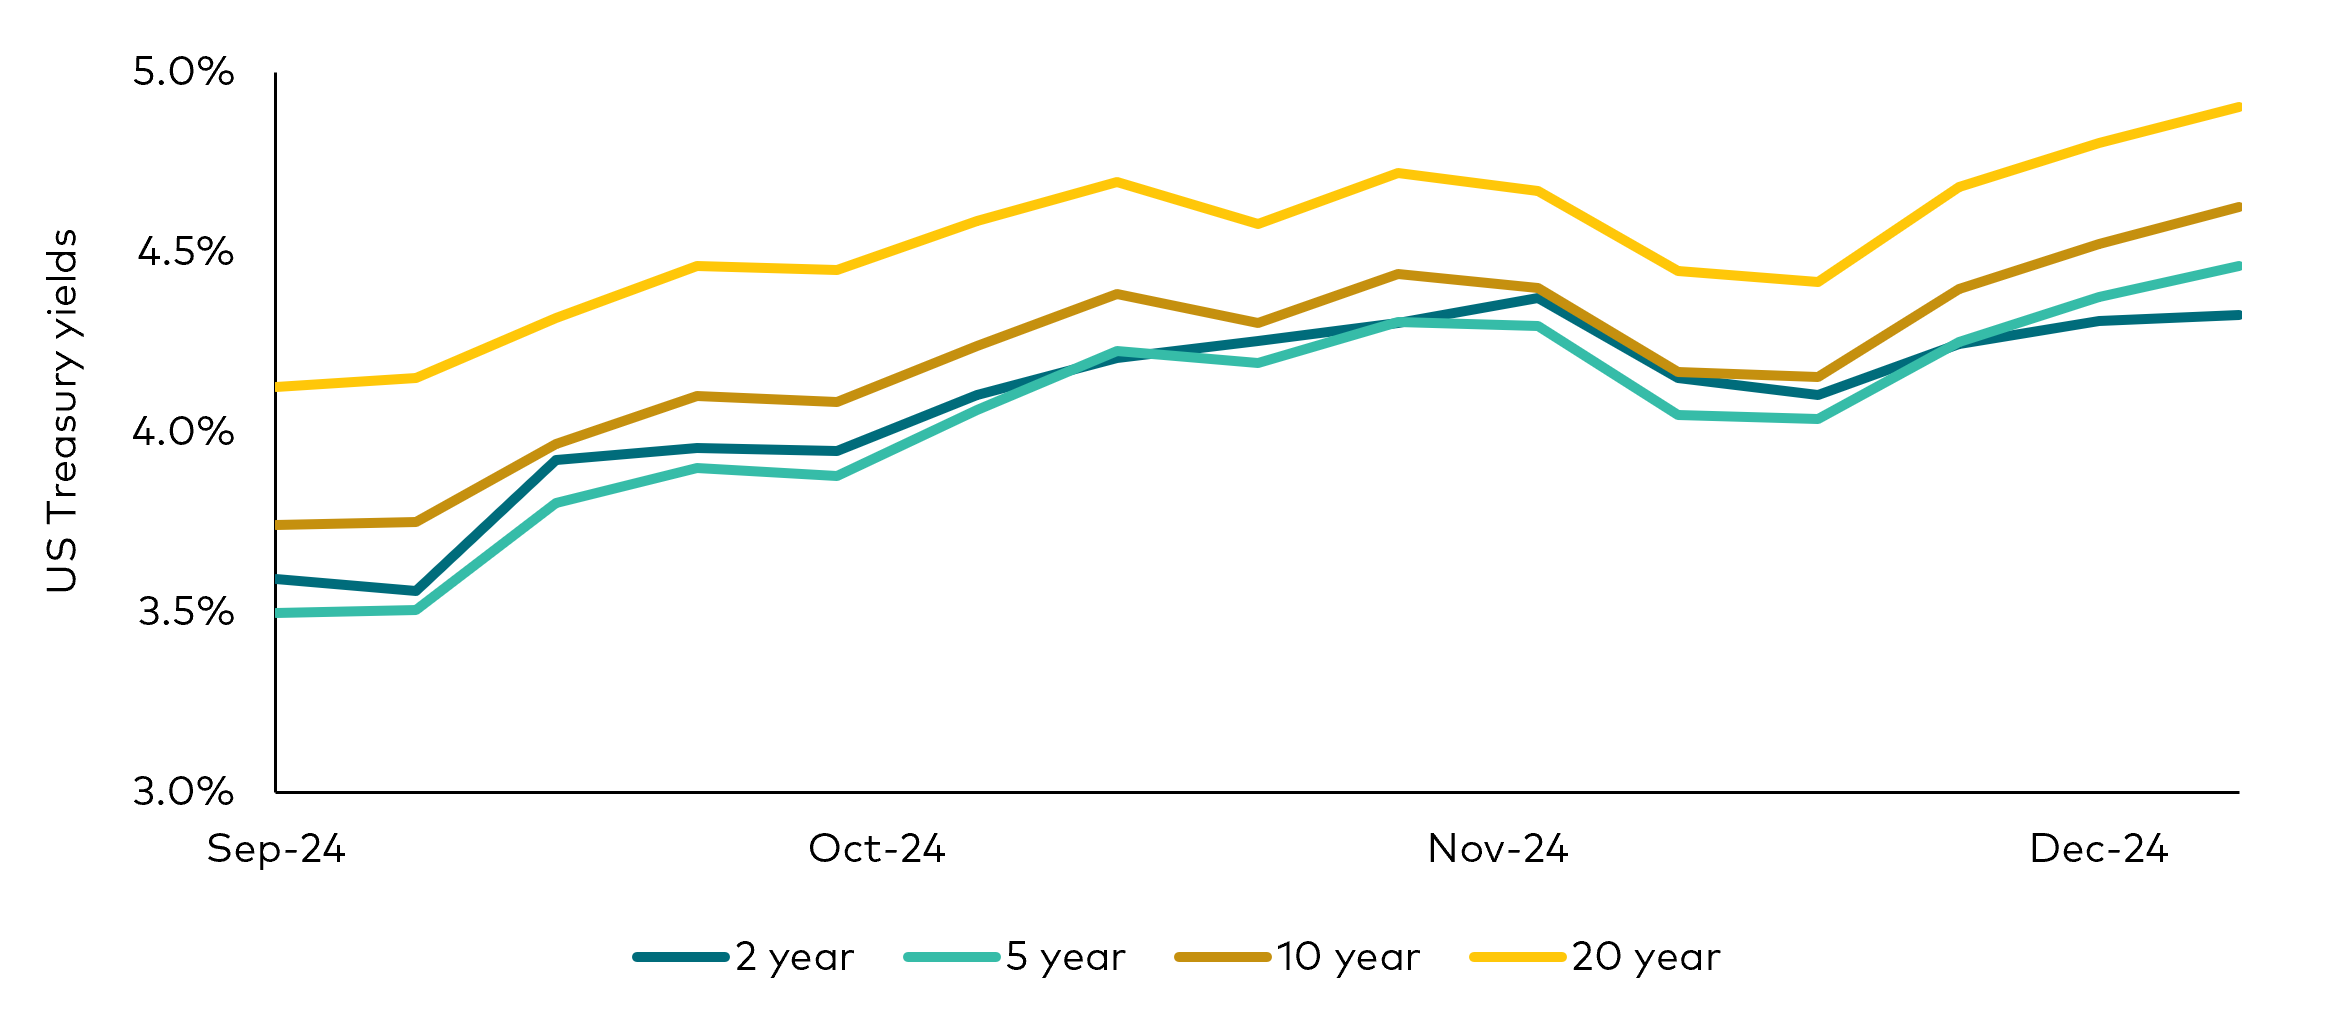
Last year, interest rates responded to shifting narratives around the US economy and Fed policy. Multiple hotter-than-expected inflation prints drove rates higher in April. Then, with the unemployment rate rising in a pattern reminiscent of previous recessions, markets reacted and yields fell sharply in the third quarter.
The Fed responded forcefully by cutting rates by 100 bps over three months. However, since their initial 50 bps cut in September, the labour market and growth data have painted a more positive picture of US economic growth and consumer health while inflation has stalled above the central bank’s target.
Yields retraced higher and gained further momentum in the aftermath of the US presidential election in November, as the market continued to digest expectations for pro-growth and potentially pro-inflationary policies from the new administration.
US Treasury yields since the September Fed rate cut
Past performance is no guarantee of future returns.
Source: Bloomberg, for the period 20 September 2024 to 31 December 2024.
Over the first half of 2025, we expect strong growth and sticky inflation to persist, keeping the US yield curve relatively flat, and yields consistently higher than they were for most of 2024. The Fed sees itself in a new phase of the cycle where the bar for further rate cuts is higher. If inflation continues to run high, as it has done in the first quarter of the past couple of years, yields on the short end of the curve could rise a bit and flatten the curve even more as the forecast cuts in 2025 get priced out.
Market pricing reflects economic expectations
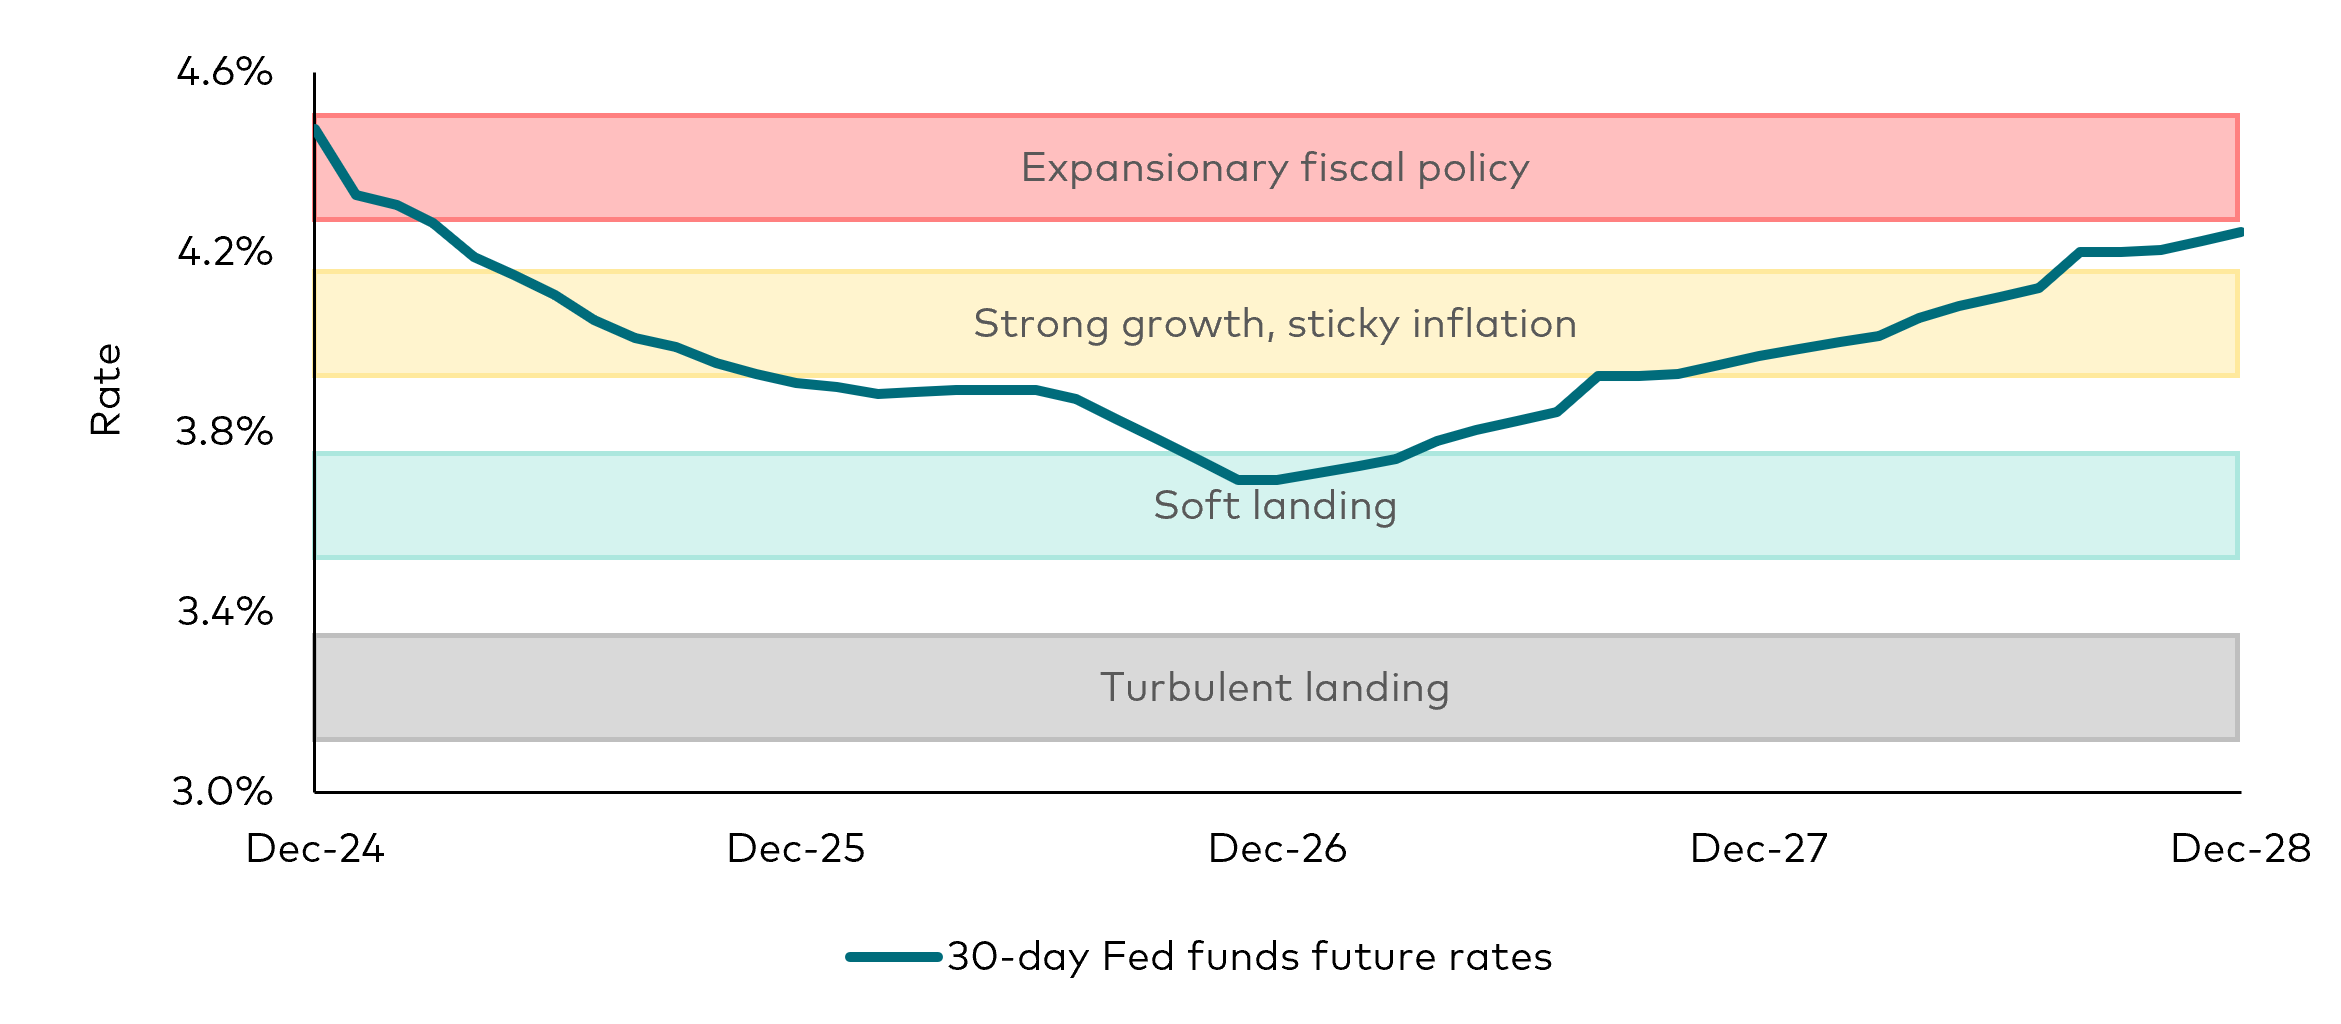
Notes: The line represents the implied Fed policy path from 31 December 2024 to 31 December 2028. Fed funds futures are financial futures contracts based on the federal funds rate.
Source: Bloomberg and Vanguard.
10-year US Treasury yield
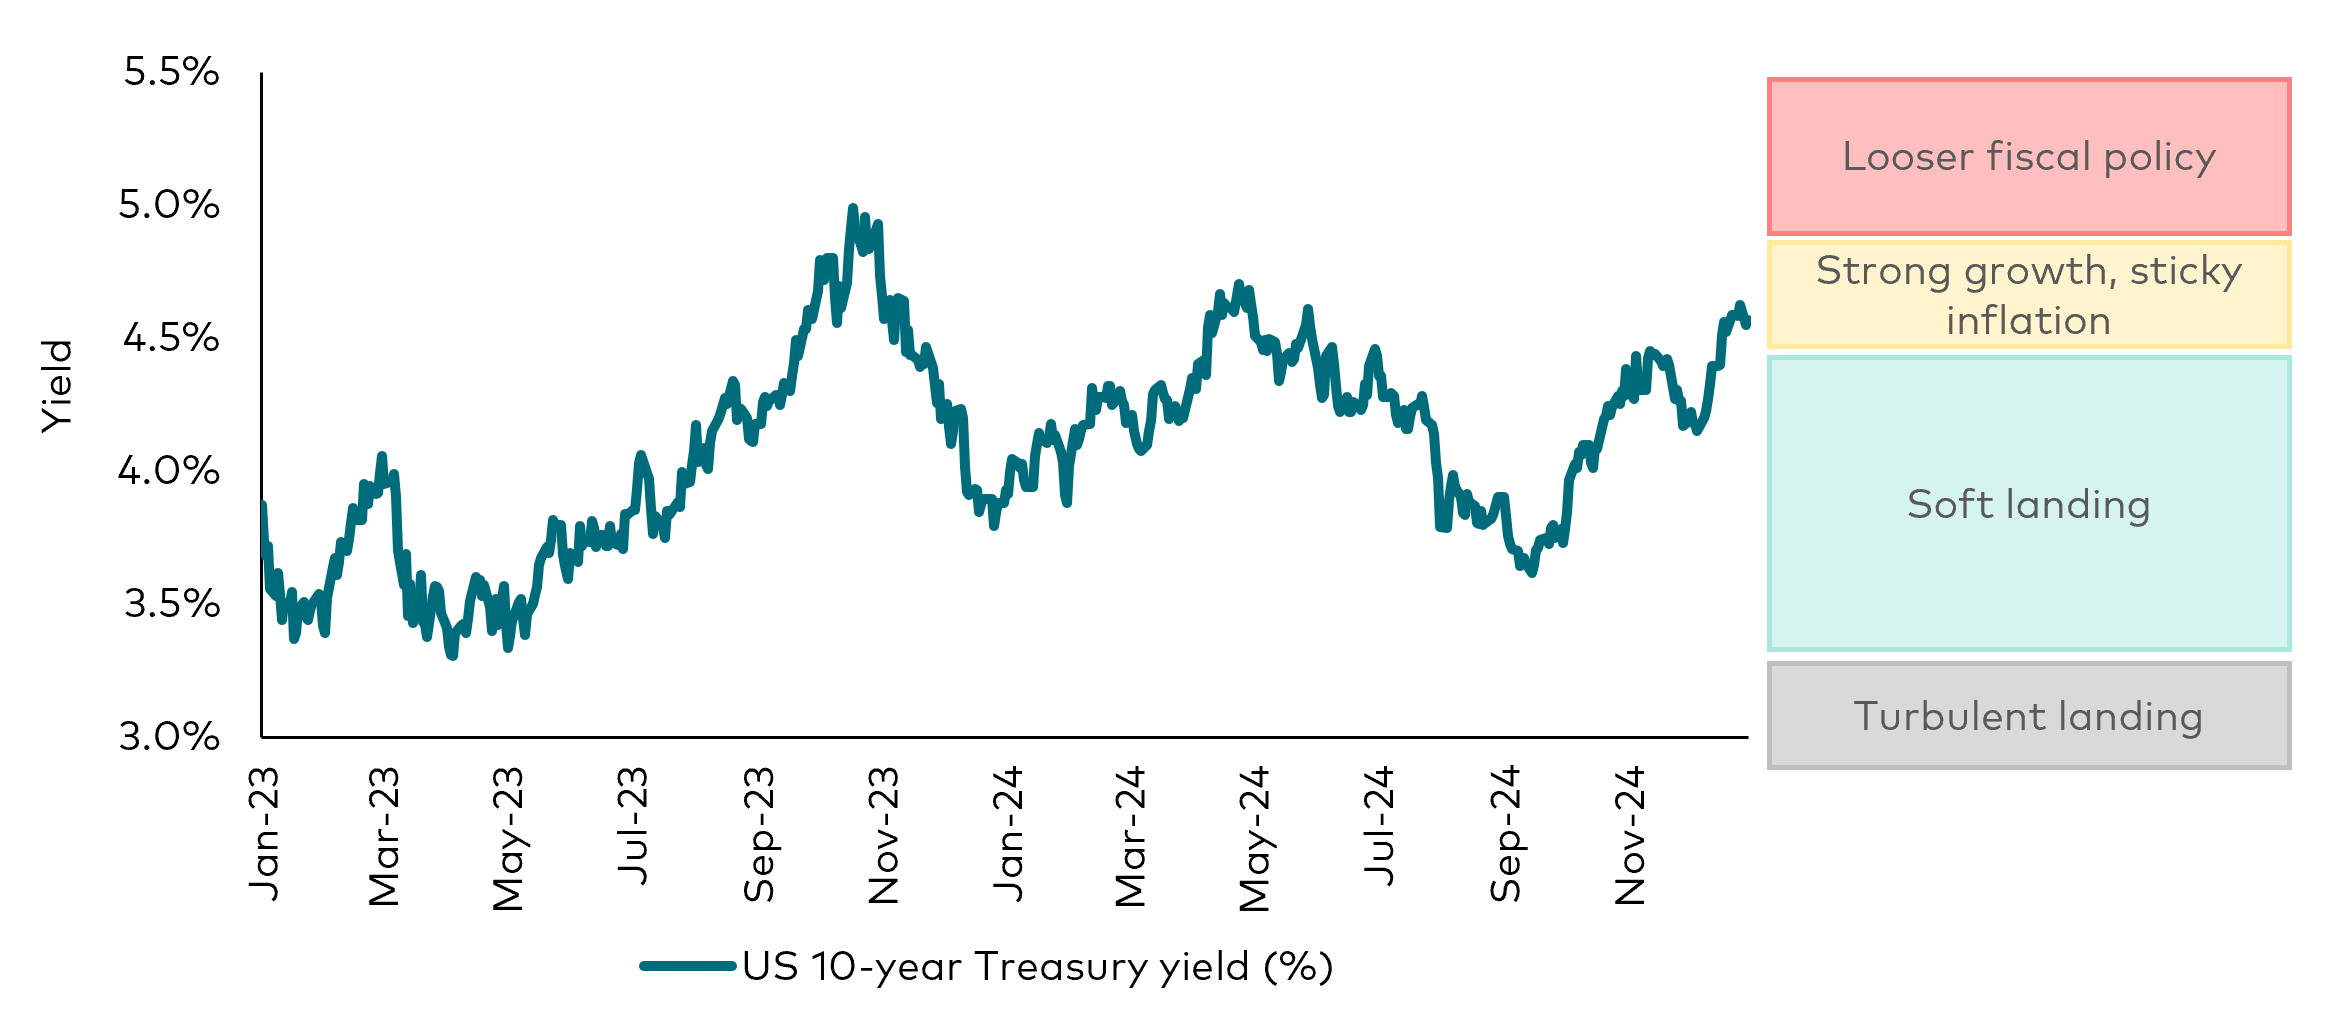
Past performance is no guarantee of future returns.
Source: Bloomberg, for the period 31 December 2022 to 31 December 2024.
Near-term, we don’t see a catalyst for a sustained rise in the long end of the yield curve. Continued flows into fixed income across maturities have helped to keep bond yields in check.
With respect to curve positioning in US rates, we favour the risk/reward mix found in the belly of the yield curve. Short- to intermediate-term yields offer a good balance between attractive income potential, with less downside price risk.
Global rates
Outside the US, inflation has declined significantly in most economies for the past two years — but so has economic growth. As inflation rates approach central bank targets, the global easing cycle is expected to continue into 2025, though the paths for policy rates are likely to vary.
European rates markets are now appropriately pricing in a weaker growth outlook that accounts for potential global trade friction and a more dovish tone from the ECB. We have reduced exposure, taking profits after a period of outperformance. We nevertheless remain positive on peripheral Europe sovereign fundamentals and would seek to add back exposure at wider spread levels.
In Japan, we anticipate that monetary policy will become more restrictive. We believe the BOJ will raise rates more aggressively than current market expectations suggest to combat domestic inflation. As a result, we are maintaining a short position in Japanese government bonds (JGBs) and will continue to position for a flatter yield curve.
Credit
Quarterly change in credit spreads by sector
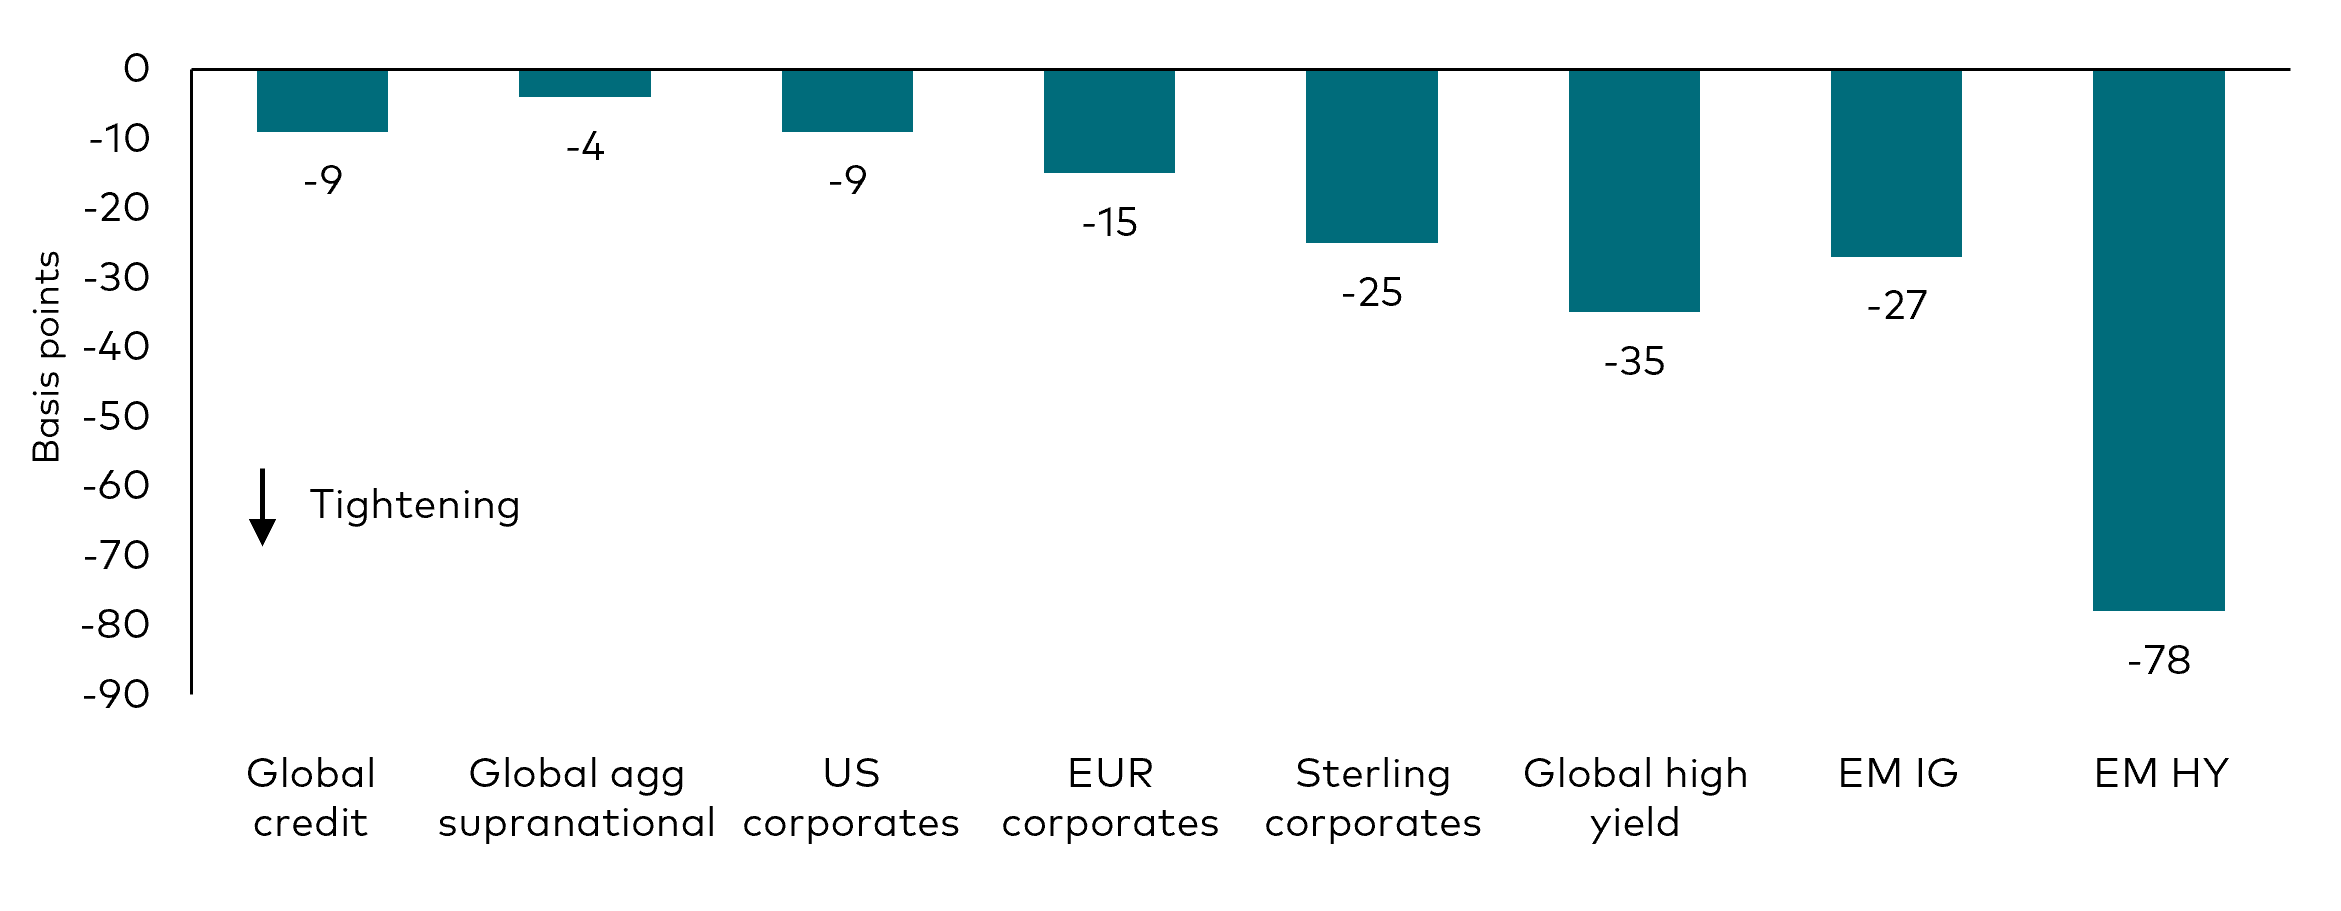
Past performance is no guarantee of future returns. The performance of an index is not an exact representation of any particular investment, as you cannot invest directly in an index.
Notes: Chart shows the quarterly changes in spreads for credit market sectors for the 3-month period from 30 September 2024 to 31 December 2024. EM IG and EM HY refer to emerging market investment-grade and emerging market high-yield, respectively.
Sources: Bloomberg and JP Morgan indices.
The positive US growth story has driven credit spreads across sectors to multi-decade lows. In 2024, excess returns were notably positive, with the highest gains observed in lower-rated bonds.
While spread levels remain narrow relative to history, we believe the vigour of the economy and robust issuer balance sheets justify the prices. All-in yields remain compelling across sectors when compared with prior decades, which has attracted investor demand across most sectors.
Credit yields remain attractive while spreads imply risk
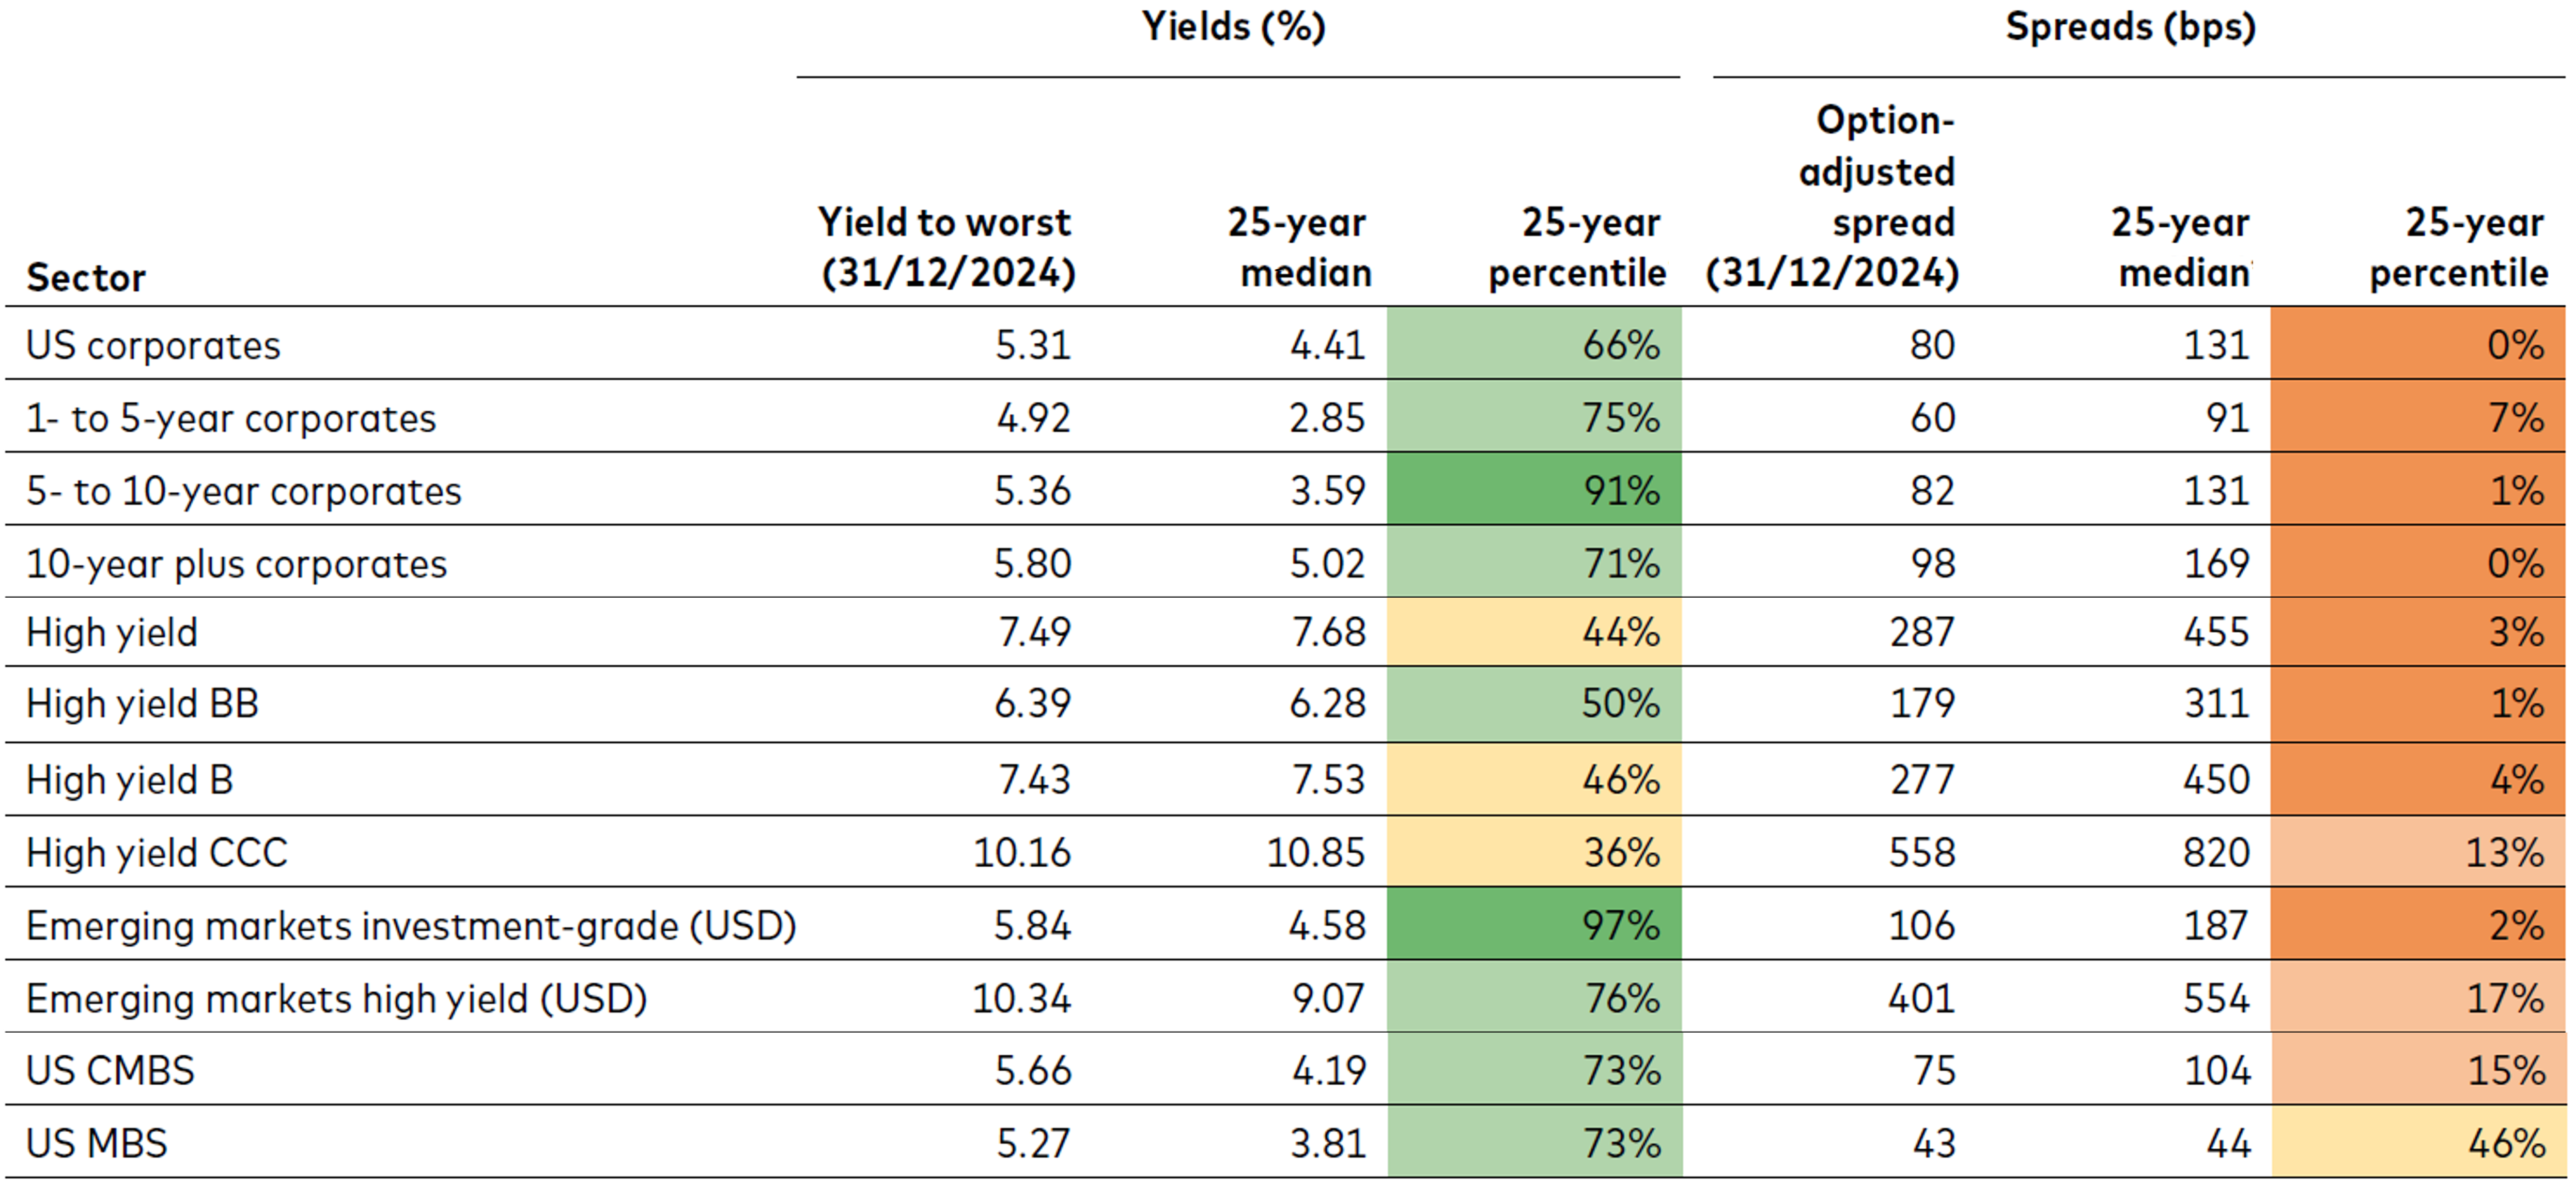
Past performance is no guarantee of future returns. The performance of an index is not an exact representation of any particular investment, as you cannot invest directly in an index.
Source: Bloomberg, as at 31 December 2024. Credit sector data go back to 31 December 1998 when available; all others use earliest data possible. Proxies used for sector indices are provided in footnotes1. Performance is provided in the base currency of the index, or for global indices, USD hedged.
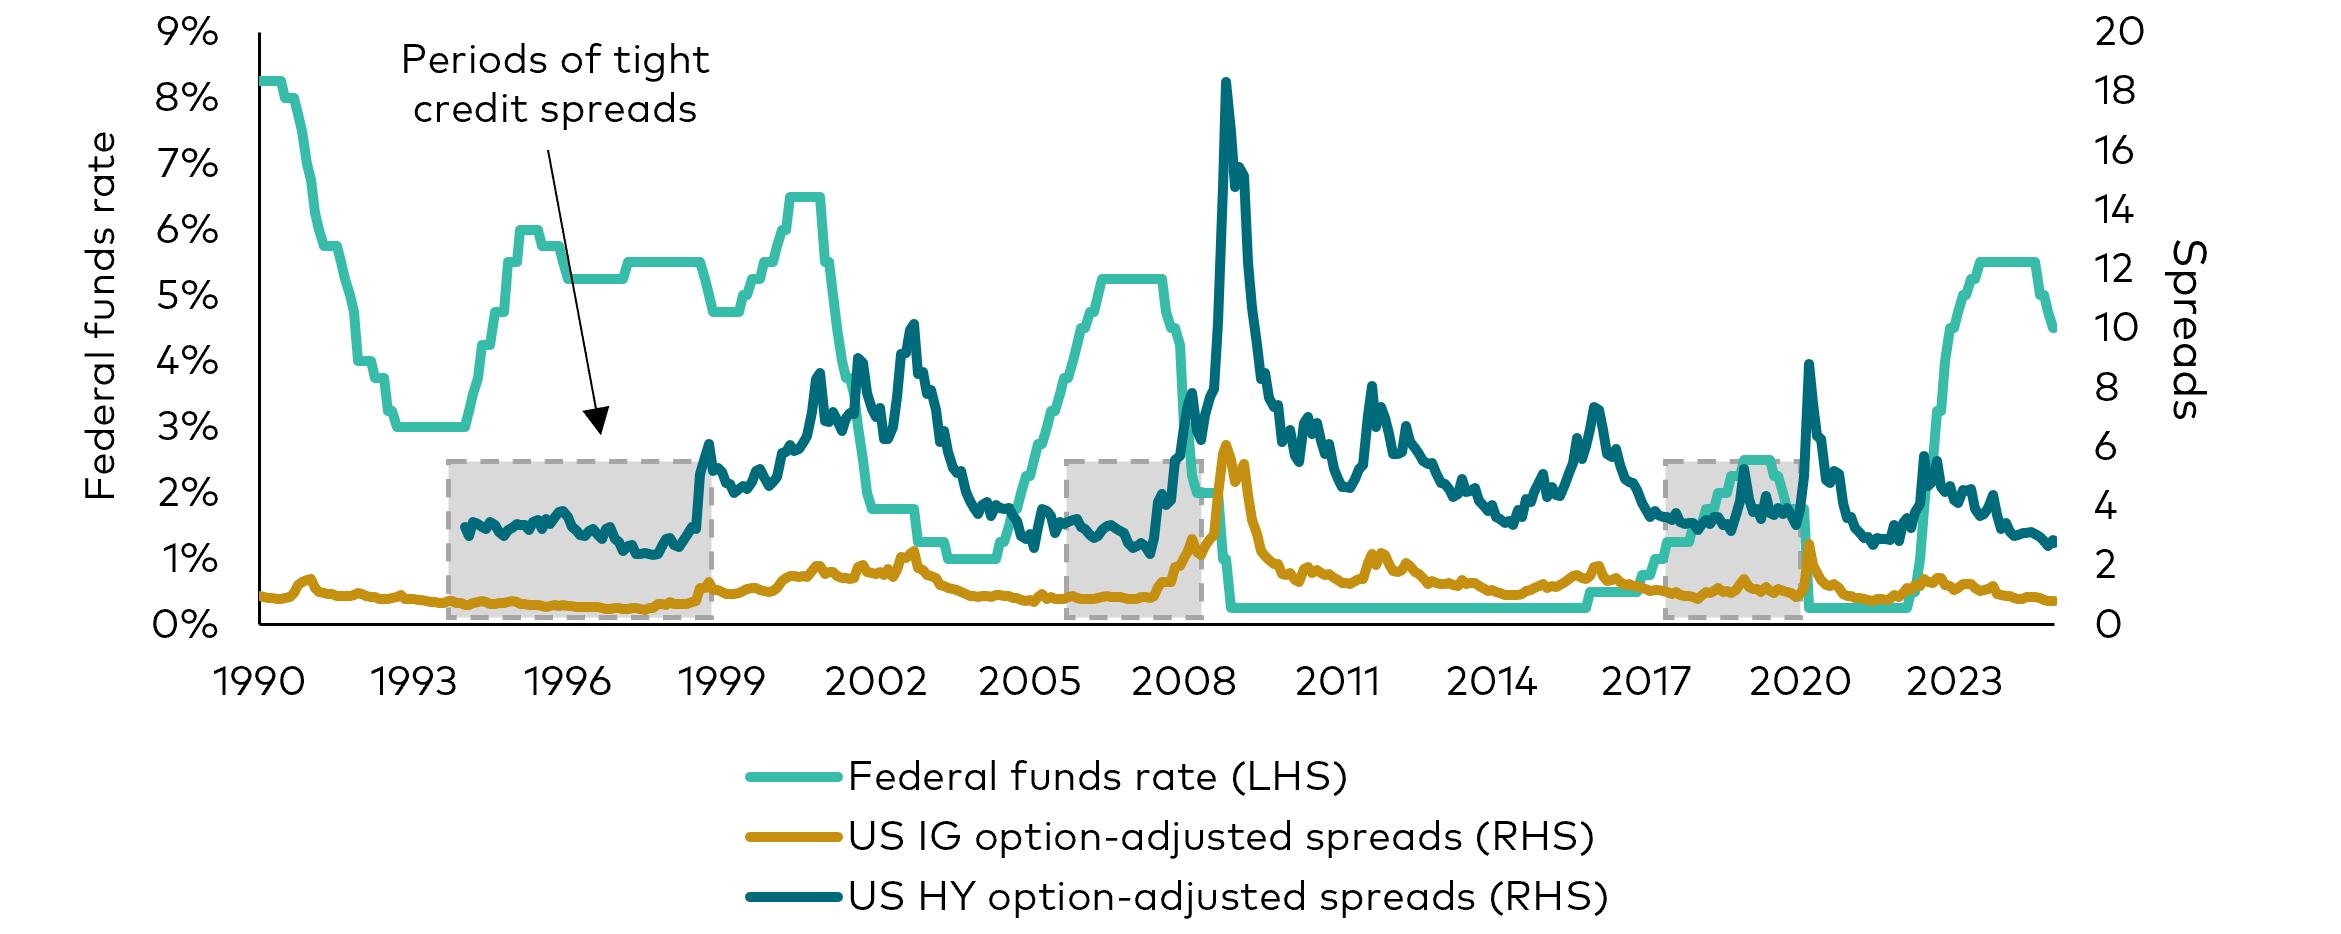
Nonetheless, there is limited room for spreads to narrow much further. Recent inflation trends have prompted the Fed to adopt a more cautious stance, which could dampen the performance of risk assets.
History shows that credit spreads can remain narrow for extended periods of time, particularly in the later stages of an economic expansion. If spreads are able to hold near their current levels, credit should outperform government bonds due to higher starting yields.
Our base case view anticipates credit spreads staying within a narrow range over the coming months. We remain constructive on credit risk but are maintaining a lower-than-average exposure.
In the US, we expect higher volatility in the coming year as new trade, tax and immigration policies are negotiated and potentially implemented. If credit fundamentals stay healthy, these volatile periods should present opportunities to add credit risk.
Our portfolios have higher conviction positions in sectors that have lagged recent tightening. We have a bias towards European corporates given their elevated spreads versus the US; and within Europe, we have a bias towards non-cyclicals and financials. We remain defensive and focused on bond selection opportunities in US high yield and emerging markets.
US credit spreads can remain tight for long periods as the Fed keeps rates high
Past performance is no guarantee of future returns.
Source: Bloomberg, for the period 1 January 1990 to 31 December 2024. Indices used: US HY option-adjusted spreads Bloomberg US Corporate High Yield Index; US IG option-adjusted spreads: Bloomberg US Corporate Investment Grade Index. Note the Bloomberg US Corporate High Yield Index began in January 1994.
Alternate scenarios
The best possible scenario for credit requires sustained economic growth and, simultaneously, an inflation backdrop that allows central banks to implement more rate cuts than currently anticipated.
A less optimistic scenario in the US would be one where inflation progress stalls, leading the Fed to communicate a pause in rate cuts. Markets may then become concerned about possible rate hikes. Fear of a prolonged period of restrictive rates would raise growth concerns and credit spreads would likely widen as a result.
However, for credit markets more broadly, the most challenging scenario for credit performance would be a sustained trend of weaker growth. Rising recession fears would result in much wider credit spreads, although the negative performance impact may be cushioned by additional, unexpected central bank cuts. While not likely over the near-term, this scenario could be a rising risk as 2025 progresses.
Emerging markets
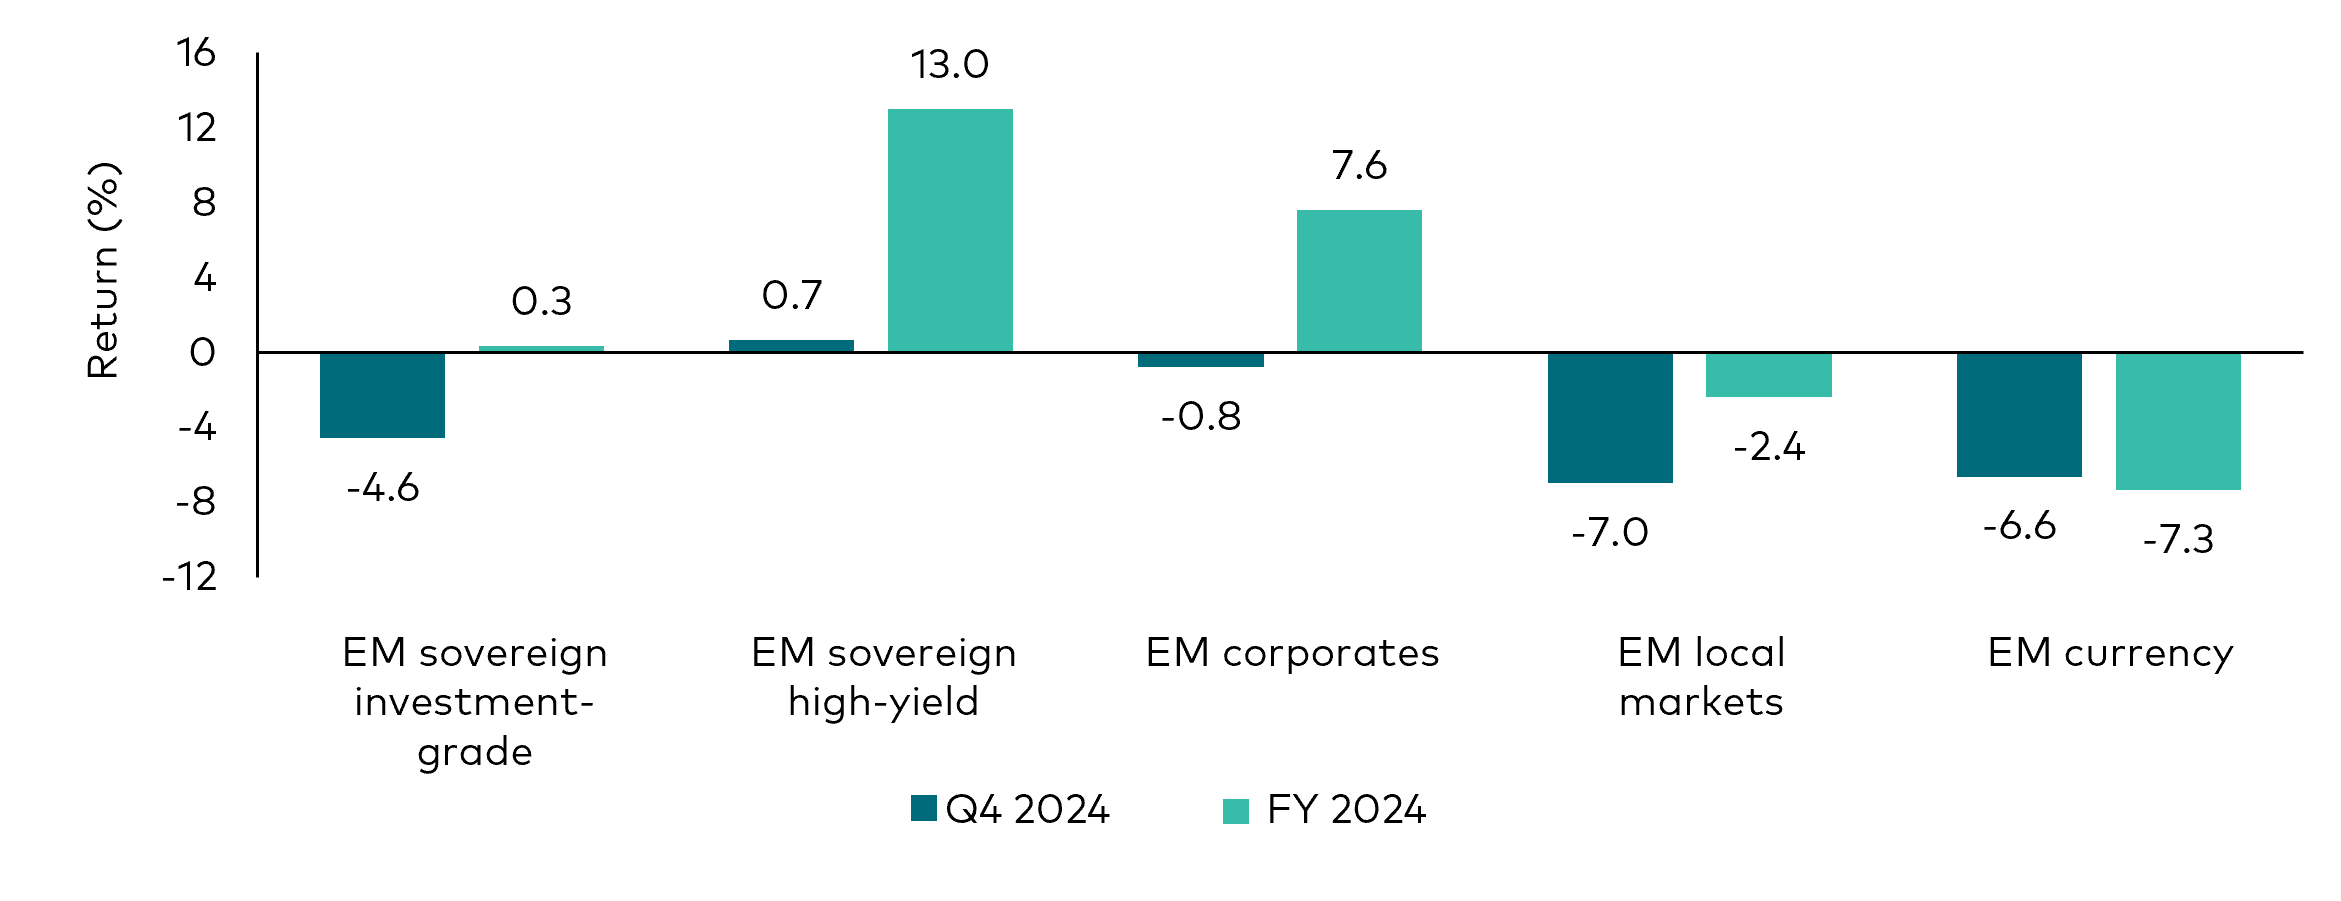
Emerging market debt returns by sector
Past performance is no guarantee of future returns. The performance of an index is not an exact representation of any particular investment, as you cannot invest directly in an index. Performance is provided on a total return basis, in the base currency.
Source: Bloomberg. Q4 2024 data from 30 September 2024 to 31 December 2024. 2024 data from 31 December 2023 to 31 December 2024. Proxies used for individual sectors provided in footnote2.
Emerging market (EM) spreads have been tightening for a while, with investment-grade (IG) spreads tighter relative to historical averages than high yield (HY) spreads. Much of this comes from the HY component of the market, however certain HY countries remain compelling.
Both EM IG and EM HY fundamentals are on an improving trajectory, as evidenced by a prolonged period of net rating upgrades. We do not anticipate major credit distress in the sovereign sphere for 2025.
Looking ahead, a 'soft landing' in the US, coupled with a modest but definitive easing of interest rates by the Fed, is supportive of EM economies and risk appetite. However, a soft patch in global growth and risk sentiment could disproportionately impact weaker credits and those with high issuance needs. The same set of credits would be vulnerable to a resetting of global yields higher.
Supply is likely to be front-loaded in 2025. This may cause cheapening in higher-quality names in the near term. However, a shift to a negative net supply dynamic later in the year could result in broad outperformance and we could see names with lower issuance outperform others.
We believe there’s ‘no free ride’ in high-beta names. Following EM’s outperformance in 2024, and with the value cushion now gone, it’s important to differentiate between names where fundamental improvements can be sustained and justify their current levels, while avoiding those that were lifted with the tide.
EM faces some challenges as the new US administration takes office. We believe credits with strong external balance sheets and less exposure to trade should be more immune from tariffs.
EM local rates have outperformed their US Treasury equivalents in recent months. Under a soft-landing scenario and weaker US dollar outlook, we think this will continue. We are starting to see opportunities in countries where inflation is gradually falling, and real yields are attractive.
Summary: Our views and strategy
Rates
| Exposure | View | Strategy |
|---|---|---|
US duration and yield curve |
The recent trend higher in yields and a steeper curve reflect the market’s view of a less accommodative policy outlook, and expectations for a surge in issuance at the start of the year. The risk/reward of owning duration is improving, given improved valuations, policy risks and the tightening of financial conditions. A substantial move higher in yields would require the market to contemplate more hawkish Fed policy or significant term premium concerns. |
We have a bias to extend duration above 4.75% on 10-year US Treasuries as long as inflation is less than 3% and there is no meaningful deficit expansion. |
Global duration and yield curve |
BOJ rate hikes and quantitative tightening to continue to pressure JGB yields higher, which should also flatten the curve. Tariffs may present significant headwinds to euro area growth. Favourable valuations on UK gilts versus German Bunds. |
We remain short JGBs and are positioned for yield curve flattening. Retain modest overweight in peripheral Europe. Long 10-year UK rates versus short 10-year German rates. |
Credit
| Exposure | View | Strategy |
|---|---|---|
Investment- grade corporates |
Corporate fundamentals remain healthy but are well reflected in narrow spreads. Potential de-regulation could provide further upside, but impact will vary across sectors. Net new issuance in 2025 should be modest and met with strong demand, absent an economic downturn. |
We’re overweight BBB-rated industrials and shorter-maturity financials. We prefer issuers that are deleveraging, and are cautious on those looking to pursue debt- funded M&A. Across the curve, we like the front end. |
High-yield corporates |
Credit fundamentals have improved given a better growth backdrop, resulting in lower default activity. Spreads are below historical averages and have limited room to absorb negative surprises. We see a positive supply/demand mix in 2025 as higher expected new issue volume should be met by strong demand for credit. |
We hold a lower-than-average allocation to the sector. Focus is on bottom-up security selection as dispersion across issuers remains high. |
Emerging markets |
Performance across countries has been uneven, creating pockets of value in some areas while others look expensive. The fiscal picture for emerging markets should continue to look favourable relative to developed markets in 2025. We expect low default activity. We are cautious given risks to trade/growth. Flows into the asset class may stall with policy uncertainty and slower Fed easing. |
We are using the first wave of 2025 issuance to add where we see value. We are defensive on names that have near-term spread-widening risk. Looking for opportunities to add local duration exposure. Prefer EM currency opportunities in Latin America versus Asia. |
1 Proxies used in the change in credit spreads chart: Bloomberg US Corporate Bond Index; Bloomberg US 1 -5 Year Corporate Bond Index; Bloomberg US 5 -10 Year Corporate Bond Index; Bloomberg US 10+ Year Corporate Index; Bloomberg Pan-European Aggregate Index; Bloomberg US Corporate High Yield Bond Index; Bloomberg Ba US High Yield Index; Bloomberg B US High Yield Index; Bloomberg Caa US High Yield Index; J.P. Morgan Emerging Markets Bond Index Global Diversified Investment Grade; J.P. Morgan Emerging Markets Bond Index Global Diversified High Yield.
2 Proxies used in the emerging market debt returns by sector chart: EM sovereign investment grade: J.P. Morgan EMBI Broad Diversified IG index, EM sovereign high yield: J.P. Morgan EMBI Broad Diversified HY index, EM corporates: J.P. Morgan CEMBI broad Diversified Composite index, EM local markets: J.P. Morgan GBI-EM Global Diversified Unhedged index, and EM currency: J.P. Morgan GBI-EM Global Diversified FX index.
Our active bond funds managed in-house
Investment risk information
The value of investments, and the income from them, may fall or rise and investors may get back less than they invested.
Past performance is not a reliable indicator of future results.
Some funds invest in emerging markets which can be more volatile than more established markets. As a result the value of your investment may rise or fall.
Funds investing in fixed interest securities carry the risk of default on repayment and erosion of the capital value of your investment and the level of income may fluctuate. Movements in interest rates are likely to affect the capital value of fixed interest securities. Corporate bonds may provide higher yields but as such may carry greater credit risk increasing the risk of default on repayment and erosion of the capital value of your investment. The level of income may fluctuate and movements in interest rates are likely to affect the capital value of bonds.
Any projections should be regarded as hypothetical in nature and do not reflect or guarantee future results.
Reference in this document to specific securities should not be construed as a recommendation to buy or sell these securities, but is included for the purposes of illustration only.
Important information
For professional investors only (as defined under the MiFID II Directive) investing for their own account (including management companies (fund of funds) and professional clients investing on behalf of their discretionary clients). In Switzerland for professional investors only. Not to be distributed to the public.
The information contained in this document is not to be regarded as an offer to buy or sell or the solicitation of any offer to buy or sell securities in any jurisdiction where such an offer or solicitation is against the law, or to anyone to whom it is unlawful to make such an offer or solicitation, or if the person making the offer or solicitation is not qualified to do so. The information in this document does not constitute legal, tax, or investment advice. You must not, therefore, rely on the content of this document when making any investment decisions.
The information contained in this document is for educational purposes only and is not a recommendation or solicitation to buy or sell investments.
Issued in EEA by Vanguard Group (Ireland) Limited which is regulated in Ireland by the Central Bank of Ireland.
Issued in Switzerland by Vanguard Investments Switzerland GmbH.
Issued by Vanguard Asset Management, Limited which is authorised and regulated in the UK by the Financial Conduct Authority.
© 2025 Vanguard Group (Ireland) Limited. All rights reserved.
© 2025 Vanguard Investments Switzerland GmbH. All rights reserved.
© 2025 Vanguard Asset Management, Limited. All rights reserved.
4182810

