- Japan is seeing its first real wage growth in more than two years, and that wage growth is feeding into broader core inflation.
- The Bank of Japan ended its negative interest-rate policy earlier this year, modestly raising rates – that looks set to continue, cautiously.
- With potential impacts across Japanese bonds, equities and the yen, it may be a good time for investors to re-assess their exposure to Japan.
Until recently, decades of quantitative easing, negative interest rates and yield curve control had made little impact in jolting Japan’s economy out of its doldrums. Minimal price growth and even deflation were symptomatic of this malaise.
But the paradigm in Japan is changing, and that resigned mindset is being upended. Japan’s central bank may go further in its rate-hiking campaign that it started earlier this year, and the recent change in the nation’s prime minister will likely not stop that momentum. If anything, the new prime minister, Shigeru Ishiba, seems more supportive of the Bank of Japan’s new direction than his predecessor.
Importing inflation
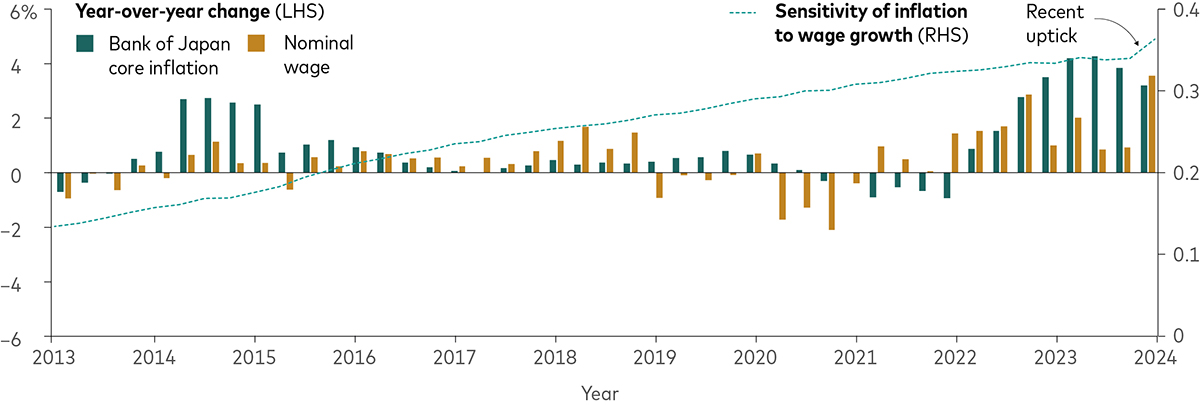
The Covid-19 pandemic and the war in Ukraine may have provided the impetus to get Japan out of deflation and into modest growth. Japan essentially imported inflation. The price shocks from imported commodities and energy have seeped into wages, resulting in Japan’s first real wage growth in more than two years. Now, that wage growth is feeding into broader core inflation, and inflation expectations have increased. For a country that had been stagnant for so long, it’s a virtuous cycle.
Higher wages feeding into broader inflation in Japan

Notes: The chart shows the statistical coefficient measuring the sensitivity of inflation to changes in wage growth. For core inflation, we use the Bank of Japan’s preferred core inflation measure, which excludes volatile energy and fresh food prices.
Sources: Vanguard calculations using data as of 31 March 2024, from CEIC, the Ministry of Internal Affairs and Communications and the Ministry of Health, Labour and Welfare.
The rebound in prices doesn’t appear to be just another false start. Private consumption is now driving demand as real wage growth turns positive, suggesting a true structural change is more likely than a one-off shock. And, with Japan’s shrinking and aging population, upward pressure on wage growth looks likely to continue.
Large Japanese companies are expected to increase wages by more than 5% this year after annual wage negotiations. Japanese consumers have among the highest savings rates in the world but they, too, will spend if they have surplus wages. In addition, inflation on the services side is stickier, so this is more of a permanent change.
Rising rates likely ahead
With inflation rising, the Bank of Japan (BOJ) ended its negative interest-rate policy earlier this year, modestly raising rates while easing its monthly bond-buying programme.
The BOJ will likely continue to normalise its monetary policy, albeit cautiously. BOJ policy will depend not just on inflation but also on the currency exchange rate and the state of capital markets. If the yen weakens relative to the US dollar and capital markets are stable, more rate hikes are likely. If the yen strengthens too sharply or the markets become too turbulent, the BOJ could reduce the pace of rate hikes or even cease them altogether.
Vanguard’s baseline forecast is for an additional policy rate increase of 25 basis points this year, with two more quarter-point hikes in 2025. This is contrary to the view of markets, which are pricing in smaller rate increases.
Yen may get closer to fair value
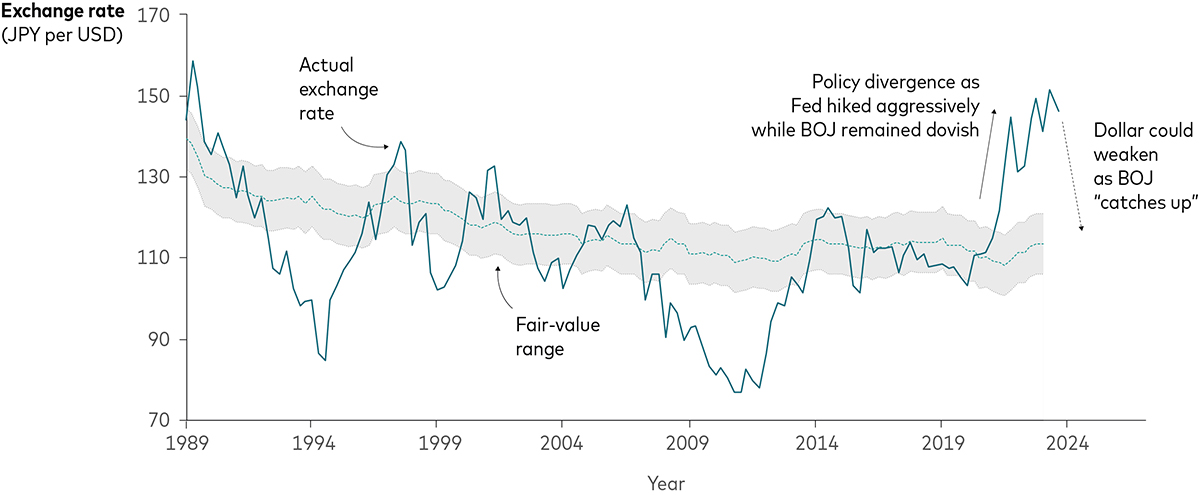
According to our proprietary model, the fundamentals of the long-term relationship between the yen and the US dollar have remained stable. Cyclical fluctuations have been the result of actions by central banks on both sides of the Pacific. Those fluctuations should normalise as policy normalises from opposite ends of the spectrum.
Yen likely to return towards fair value as policy rates converge

Notes: The fair-value range is Vanguard’s fair-value estimate plus or minus half a standard deviation. Our fair-value estimate is a proprietary measure that compares the US dollar with a range of developed markets currencies (in this case the Japanese yen). The fair-value estimate is based on the portion of exchange rate movements that can be explained through differentials in relative economic strength, measured by productivity (GDP per capita at purchasing power parity) and long-term real rates.
Sources: Vanguard calculations using data as of 31 March 2024, from Refinitiv and the International Monetary Fund. Actual exchange rates are through 31 August 2024.
IMPORTANT: The projections and other information generated by the Vanguard Capital Markets Model (VCMM) regarding the likelihood of various investment outcomes are hypothetical in nature, do not reflect actual investment results, and are not guarantees of future results. Distribution of return outcomes from the VCMM are derived from 10,000 simulations for each modeled asset class. Simulations are as of 31 March 2024. Results from the model may vary with each use and over time. For more information, please see the Notes section below.
In terms of monetary cycles, Japan today is where the US and most other developed markets were two years ago. With the BOJ hiking rates and the US Federal Reserve (Fed) cutting, the difference between Japanese and US interest rates will decrease, likely causing the yen to strengthen against the dollar. Currently the yield curve is steeper in Japan than in the US. We would expect the US yield curve to steepen as the Fed continues to cut rates and the Japanese yield curve to flatten as the BOJ raises rates.
A more attractive Japanese market
The structural changes in Japan go beyond the impact on yield curves and currencies. In the past, surprise interest rate moves by the BOJ made Japan’s fixed income market unattractive for foreign investors. Furthermore, the BOJ owns the majority of Japanese government bonds (JGBs), creating an environment where prices and yields do not reflect true market forces. But the BOJ has recently moved towards greater transparency, signalling its interest rate moves in advance. And, while the BOJ still owns 55% of JGBs, it has eased back its ownership of those bonds, increasing the odds of the yen converging to fair value.
The takeaway for investors is that a market that was easy to ignore in recent decades because of economic stagnation and the BOJ’s bond market dominance now appears to be a potential source of alpha.
In light of these shifts, investors may want to consider their long-term asset allocation strategies. A stronger yen would strengthen returns from Japanese equities for investors whose investments are denominated in currencies weakening against the yen. Fixed income is a little more complicated. Higher interest rates would lead to greater volatility in the short- and medium-term, something a strengthening yen could help offset. However, in the longer term, higher yields bode well for future returns, reaffirming the role of Japanese bonds in globally diversified portfolios.
Related funds
IMPORTANT: The projections or other information generated by the Vanguard Capital Markets Model® regarding the likelihood of various investment outcomes are hypothetical in nature, do not reflect actual investment results, and are not guarantees of future results. VCMM results will vary with each use and over time. The VCMM projections are based on a statistical analysis of historical data. Future returns may behave differently from the historical patterns captured in the VCMM. More important, the VCMM may be underestimating extreme negative scenarios unobserved in the historical period on which the model estimation is based.
The Vanguard Capital Markets Model® is a proprietary financial simulation tool developed and maintained by Vanguard’s primary investment research and advice teams. The model forecasts distributions of future returns for a wide array of broad asset classes. Those asset classes include US and international equity markets, several maturities of the U.S. Treasury and corporate fixed income markets, international fixed income markets, US money markets, commodities, and certain alternative investment strategies. The theoretical and empirical foundation for the Vanguard Capital Markets Model is that the returns of various asset classes reflect the compensation investors require for bearing different types of systematic risk (beta). At the core of the model are estimates of the dynamic statistical relationship between risk factors and asset returns, obtained from statistical analysis based on available monthly financial and economic data from as early as 1960. Using a system of estimated equations, the model then applies a Monte Carlo simulation method to project the estimated interrelationships among risk factors and asset classes as well as uncertainty and randomness over time. The model generates a large set of simulated outcomes for each asset class over several time horizons. Forecasts are obtained by computing measures of central tendency in these simulations. Results produced by the tool will vary with each use and over time.
The primary value of the VCMM is in its application to analysing potential client portfolios. VCMM asset-class forecasts—comprising distributions of expected returns, volatilities, and correlations—are key to the evaluation of potential downside risks, various risk–return trade-offs, and the diversification benefits of various asset classes. Although central tendencies are generated in any return distribution, Vanguard stresses that focusing on the full range of potential outcomes for the assets considered, such as the data presented in this paper, is the most effective way to use VCMM output.
The VCMM seeks to represent the uncertainty in the forecast by generating a wide range of potential outcomes. It is important to recognise that the VCMM does not impose “normality” on the return distributions, but rather is influenced by the so-called fat tails and skewness in the empirical distribution of modeled asset-class returns. Within the range of outcomes, individual experiences can be quite different, underscoring the varied nature of potential future paths. Indeed, this is a key reason why we approach asset-return outlooks in a distributional framework.
Investment risk information
The value of investments, and the income from them, may fall or rise and investors may get back less than they invested.
Important information
This is a marketing communication.
For professional investors only (as defined under the MiFID II Directive) investing for their own account (including management companies (fund of funds) and professional clients investing on behalf of their discretionary clients). In Switzerland for professional investors only. Not to be distributed to the public.
The information contained herein is not to be regarded as an offer to buy or sell or the solicitation of any offer to buy or sell securities in any jurisdiction where such an offer or solicitation is against the law, or to anyone to whom it is unlawful to make such an offer or solicitation, or if the person making the offer or solicitation is not qualified to do so. The information does not constitute legal, tax, or investment advice. You must not, therefore, rely on it when making any investment decisions.
The information contained herein is for educational purposes only and is not a recommendation or solicitation to buy or sell investments.
Issued in EEA by Vanguard Group (Ireland) Limited which is regulated in Ireland by the Central Bank of Ireland.
Issued in Switzerland by Vanguard Investments Switzerland GmbH.
Issued by Vanguard Asset Management, Limited which is authorised and regulated in the UK by the Financial Conduct Authority.
Issued in EEA by Vanguard Group Europe Gmbh, which is regulated in Germany by BaFin.
© 2024 Vanguard Group (Ireland) Limited. All rights reserved.
© 2024 Vanguard Investments Switzerland GmbH. All rights reserved.
© 2024 Vanguard Asset Management, Limited. All rights reserved.
© 2024 Vanguard Group Europe Gmbh. All rights reserved.