- Enthusiasm for AI may have driven the overvaluation of US equities – and growth stocks in particular – throughout 2024.
- Despite the vast sums of money which will continue to be spent on AI, we’re unlikely to experience an AI-driven economic boom in 2025.
- Investors are advised to temper any expectations that economic growth and corporate profits are set for near-term acceleration.
“We are particularly curious as to whether AI-enabled growth in workforce productivity might help drive improvements in standards of living by offsetting the headwind of ageing populations. In brief, count me as a cautious optimist.“
Chief Economist and Head of Investment Strategy Group, Vanguard

I’m optimistic about the long-term potential of artificial intelligence (AI) to power big increases in worker productivity and economic growth. But I’m pessimistic that AI can justify lofty equity valuations or save us from an economic soft patch this year or next.
As is often the case with new technology, it’s likely to take many years to realise the full potential of AI. While substantial benefits appear likely, a meaningful risk of disappointment remains.
This is an attempt to connect the dots between the current level of share prices, an approaching slowdown in the US economy and the long-term promise of the latest technology to command the world’s attention.
$1 trillion may be invested in AI, but not by the end of 2025
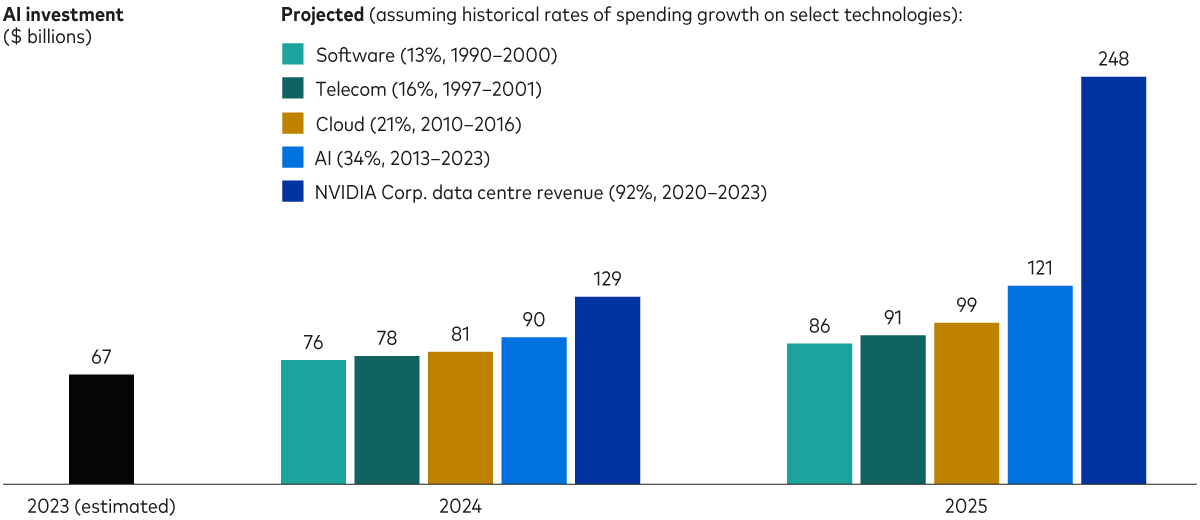
A common narrative in AI circles is that tech firms, utilities and other businesses will spend a combined $1 trillion or more to advance the technology in the coming years1. Such a sum may be spent, but it’s not going to happen by the end of next year, by which time we expect the US economy to have slowed. We estimate that it would take $1 trillion in AI-related spending to push economic growth in 2025 above the trend of roughly 2%.
Investments in AI: Unprecedented but well shy of $1 trillion

Note: Historical figures reflect compounded annual growth rates.
Sources: Vanguard; historical telecommunications and cloud spending data are from the US Federal Reserve’s FEDS Notes, Own-Account IT Equipment Investment, October 2017; Data for historical AI spending and estimate of actual 2023 spending in the United States are from Stanford University’s Artificial Intelligence Index Report 2024; Data for historical software spending are from the U.S. Bureau of Economic Analysis; and data for NVIDIA Corp. revenue are from Ycharts.com.
As shown in the chart above, last year, US investments in AI totalled an estimated $67 billion. To project such spending in the near term, we grossed up last year’s investments in AI by various annualised rates of growth ranging from 13% to 34%. Those hypothetical growth rates reflect the rate of growth in AI investments over the last decade as well as the rates of investment in three other broad technologies in their heydays. Those rates of growth would leave AI spending this year and next in the $76 billion to $121 billion range.
Even if investment in AI suddenly nearly doubled this year and next—mirroring the near doubling of NVIDIA Corp.’s data centre revenues in recent years—AI spending would amount to “only” about $129 billion in 2024 and $248 billion in 2025. Those would be tremendous outlays. Perhaps unprecedented. But $1 trillion in AI investment by 2025 would require 286% growth. That’s probably not going to happen, which means we’re unlikely to experience an AI-driven economic boom in 2025.
Enthusiasm for AI may explain much of the recent ardour for stocks
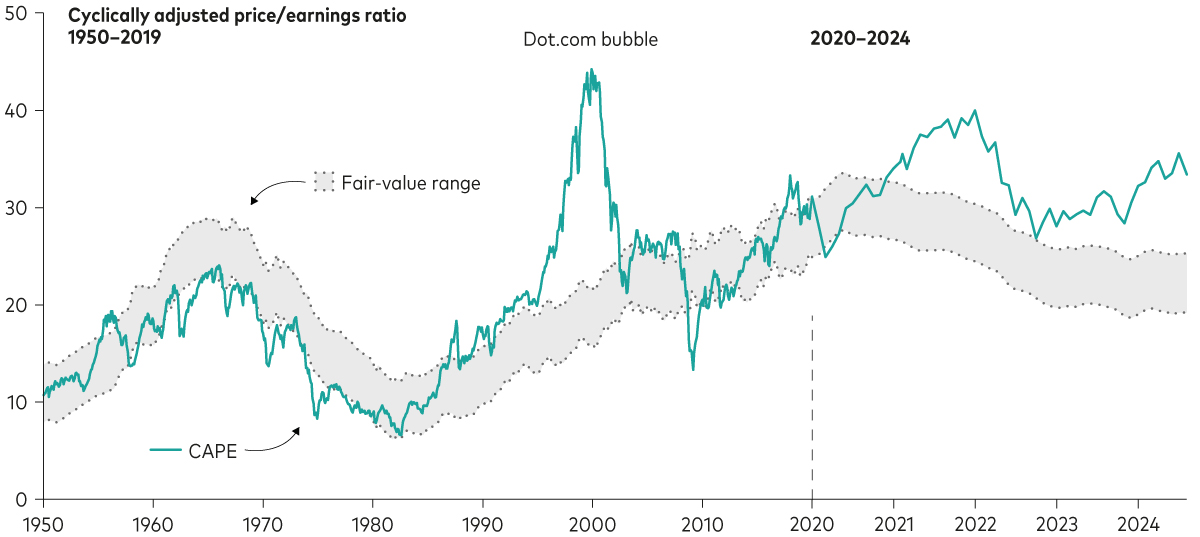
We have been cautioning investors for some time that US stocks—and growth stocks, in particular—are richly priced. Indeed, the cyclically adjusted price-to-earnings ratio (CAPE) of the US stock market stands at about 32% above our estimate of its fair value2. While growth stocks and the broad stock market appear to be overvalued, small-capitalisation, value and non-US stocks appear to be fairly valued.
US stock prices remain stretched despite recent pullbacks

Notes: Vanguard’s US fair-value CAPE is based on a statistical model that adjusts CAPE measures for the level of inflation and interest rates. The statistical model specification is a three-variable vector error correction that includes equity-earnings yields, 10-year trailing inflation and 10-year US Treasury yields estimated from 1 January 1940 through to 5 August 2024. Details were published in the 2017 Vanguard research paper Global Macro Matters: As US Stock Prices Rise, the Risk-Return Trade-off Gets Tricky. A declining fair-value CAPE suggests that higher equity-risk premium (ERP) compensation is required, whereas a rising fair-value CAPE suggests that the ERP is compressing.
Sources: Vanguard calculations, based on data as at 5 August 2024, from Robert Shiller’s website, the U.S. Bureau of Labor Statistics; the Federal Reserve Board; Refinitiv and Global Financial Data.
My colleagues and I have been focused on the economic promise of AI for some time. We are particularly curious as to whether AI-enabled growth in workforce productivity might help drive improvements in standards of living by offsetting the headwind of ageing populations. In brief, count me as a cautious optimist. Butthe rapid economic and earnings growth that would correct the current excess valuation of the US stock market is improbable, at best.
Corporate profits would have to soar to erase stocks’ overvaluation
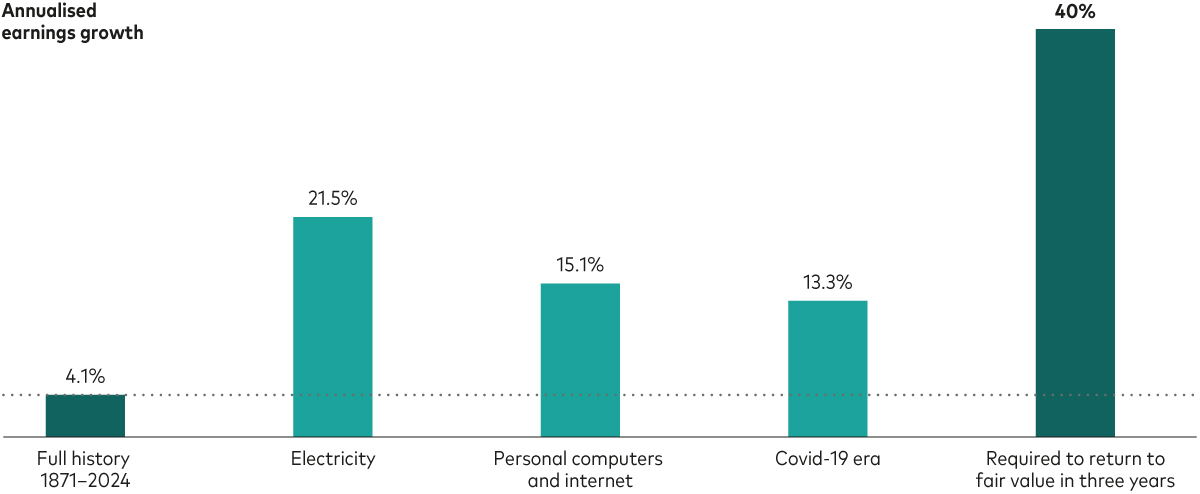
Our final chart shows that US corporate earnings growth since 1871 has averaged 4% per year. It also shows that, in strong periods, earnings growth has been much higher.
We wondered how fast profits would have to grow to unwind the excess in the US stock market. Assuming a three-year horizon for a return to fair value, the answer is about 40% per year. This is double the annualised rate of the 1920s, when electricity lit up the nation - not to mention economic output and corporate income statements.
Even assuming an AI-driven economic boom in 2025, US stocks appear overvalued

Notes: “Full history” refers to the period from January 1871 to March 2024. “Electricity” refers to the period from December 1921 to March 1930. “Personal computer and internet” refers to the period from March 1992 (after the early 1990s recession) to December 1999. “Covid-19 era” refers to the period from March 2020 to March 2024. The bar “Required to return to fair value in three years” represents the required annualised earnings growth rate for the cyclically adjusted price/earnings ratio to revert to a fair value of 23.8 by December 2027, assuming an annualised S&P 500 Index price increase of 5% and inflation at 2%.
Sources: Vanguard calculations, based on data from Robert Shiller.
“Growing out” of the overvaluation requires earnings to grow at roughly 40% per year. With profit margins close to record highs, most of a hypothetical 40% annualised profits jump would have to come from soaring corporate revenues. But slowing economic growth precludes soaring sales. My team’s forecast of US economic growth in 2025 is 1%–1.5%, which would be down from our expectation of 2% growth this year.
Human intelligence remains irreplaceable
The promise of AI is real. Our research suggests that the odds of an AI-driven surge in labour productivity are between 45% and 55%. In that scenario, we believe the US economy would grow at a real (inflation-adjusted) annualised rate of about 3.1% between 2028 and 2040. The intervening years reflect the need for additional investments in the technology and time for them to pay off.
At the same time, we see meaningful risk—a 30% to 40% chance—that AI produces more modest benefits that are insufficient to overcome ever-larger government deficits driven by age-related spending. In that case, long-term economic growth might reach only about 1% per year.
Investors looking to connect the dots between the current level of share prices, probable levels of economic activity and the widespread enthusiasm for AI would be well-advised to temper any expectations that economic growth and corporate profits are set for near-term acceleration. Instead, as ever, they’d be well-served to apply good sense in building and maintaining well-diversified portfolios that reflect their tolerance for risk and their investment horizons. Given growth rates, they should also be prepared to endure periodic downturns that would push stock prices closer to their fair values.
1 See, for example, Goldman Sachs’ Gen AI: Too Much Spend, Too Little Benefit? (June 2024).
2 Our fair-value CAPE uses the Standard & Poor’s 500 Index as a proxy for the market. It is defined as the price level of the index divided by the 10-year average of the real (inflation-adjusted) aggregate earnings of the index’s constituent companies. Our fair-value adjustment also considers the changing levels of market interest rates.
Investment risk information
The value of investments, and the income from them, may fall or rise and investors may get back less than they invested.
Important information
For professional investors only (as defined under the MiFID II Directive) investing for their own account (including management companies (fund of funds) and professional clients investing on behalf of their discretionary clients). In Switzerland for professional investors only. Not to be distributed to the public.
The information contained herein is not to be regarded as an offer to buy or sell or the solicitation of any offer to buy or sell securities in any jurisdiction where such an offer or solicitation is against the law, or to anyone to whom it is unlawful to make such an offer or solicitation, or if the person making the offer or solicitation is not qualified to do so. The information does not constitute legal, tax, or investment advice. You must not, therefore, rely on it when making any investment decisions.
The information contained herein is for educational purposes only and is not a recommendation or solicitation to buy or sell investments.
Issued in EEA by Vanguard Group (Ireland) Limited which is regulated in Ireland by the Central Bank of Ireland.
Issued in Switzerland by Vanguard Investments Switzerland GmbH.
Issued by Vanguard Asset Management, Limited which is authorised and regulated in the UK by the Financial Conduct Authority.
© 2024 Vanguard Group (Ireland) Limited. All rights reserved.
© 2024 Vanguard Investments Switzerland GmbH. All rights reserved.
© 2024 Vanguard Asset Management, Limited. All rights reserved.