- Following strong performance from growth equities, investors may want to diversify their core beta holdings with dividend exposure.
- Dividends can afford portfolios a buffer against inflation and recession, which could help in the face of uncertainty.
- Exposure to global dividends allows investors to counteract the seasonality of distributions while reducing the risk associated with relying on specific markets.
After a long equity rally, can we expect continued price returns?
Investors in broad US equity exposures have been well rewarded during the past year and half. The source of the returns is no secret. The so-called Magnificent 7 companies1 had a great run in 2023 and, to some extent, that run has continued in 2024, helping to drive broader equity benchmarks. But momentum in these stocks has been challenged more recently; Tesla is down about 33% year to date, while Apple’s return so far in 2024 is roughly two thirds that of the S&P 5002. Such details can become lost in the shuffle when Nvidia, the recent top performer among the Magnificent 7, has returned 155% in 2024 (following a 239% rise in 2023).
Investors could be forgiven for wondering if too much growth is baked into equity market valuations, especially amid tight monetary conditions, geopolitical risk and potential recession. In light of such worries, return expectations could become more anchored to dividends than price appreciation. The notion that “cash is king, profit is fleeting” may well resonate with investors if companies signal any issues with meeting earnings expectations. When companies face hard times, dividend payers typically attempt to continuing paying dividends whenever possible, whereas earnings per share (EPS) are often more likely to take a hit.
Don’t underestimate the power of dividends
As both a source of real income preservation and as a performance compounder, dividends can play an important role in portfolio returns when harnessed effectively over the long term. For investors who might be looking to diversify away from core beta holdings, dividends can afford portfolios a buffer against inflation and recessionary environments.
Historical analysis3 highlights dividends' effectiveness in outpacing inflation and mitigating the impacts of economic recessions over the past century. This attribute makes dividends an invaluable component of long-term investment strategies. Dividend per share levels have held up favourably versus earnings per share during a variety of recessionary periods going back many decades. For example, during the global financial crisis (2007-2009), when the S&P 500 fell by 41%, earnings per share plummeted by 92% while dividends per share fell by only 6%4.
This resilience can play a pivotal role when it comes to maintaining income streams and to harnessing total return, combining price return and that of reinvested dividends.
Cast your net wide with global dividends
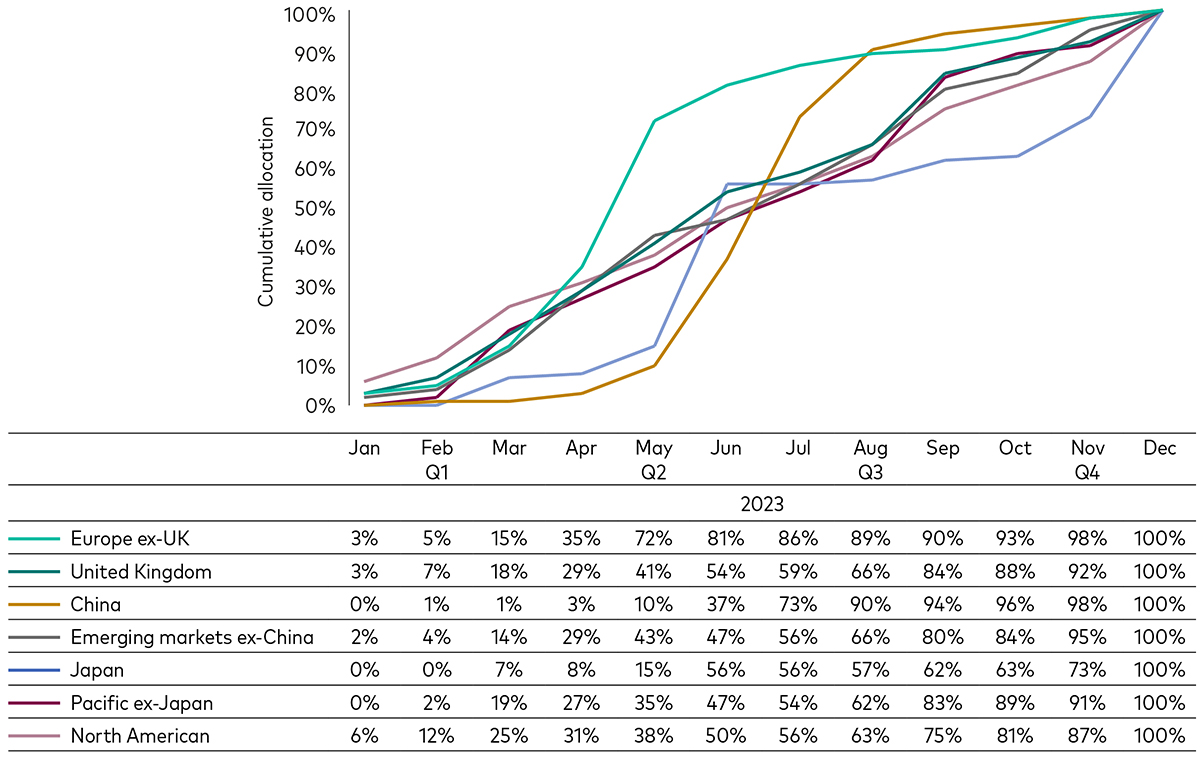
To maximise the benefits of dividends, investors should look beyond purely high dividend yields and consider the timing and consistency of payouts. Seasonal variations between regions can be meaningful, as the chart below illustrates, with most North American companies paying quarterly dividends whereas firms in China, continental Europe and the UK tend to distribute annually or semi-annually. distributions. A diversified, global dividend exposure allows investors to access a smoother dividend stream over time.
Seasonality of dividend payouts
Global dividend payouts by region

Past performance is not a reliable indicator of future returns.
Source: FactSet, Vanguard. Data as of 31 December 2023 and based on FTSE All-World Index constituents.
Additionally, by investing in dividend-paying stocks across different markets and sectors, investors can protect themselves against sector-specific downturns and geopolitical risks that might affect specific regions. For example, during the first wave of Covid-19 lockdowns in 2020, banks in Europe suspended dividends to provision for loan losses (as mandated by regulators). Although many of the banks could afford the payouts, most distributions postponed to 2021 and thus deprived investors of regular income. A broad, diversified approach not only stabilises the income stream but also enhances the resilience of the total return proposition, making it well-suited to withstand economic fluctuations.
Capture value while avoiding value traps
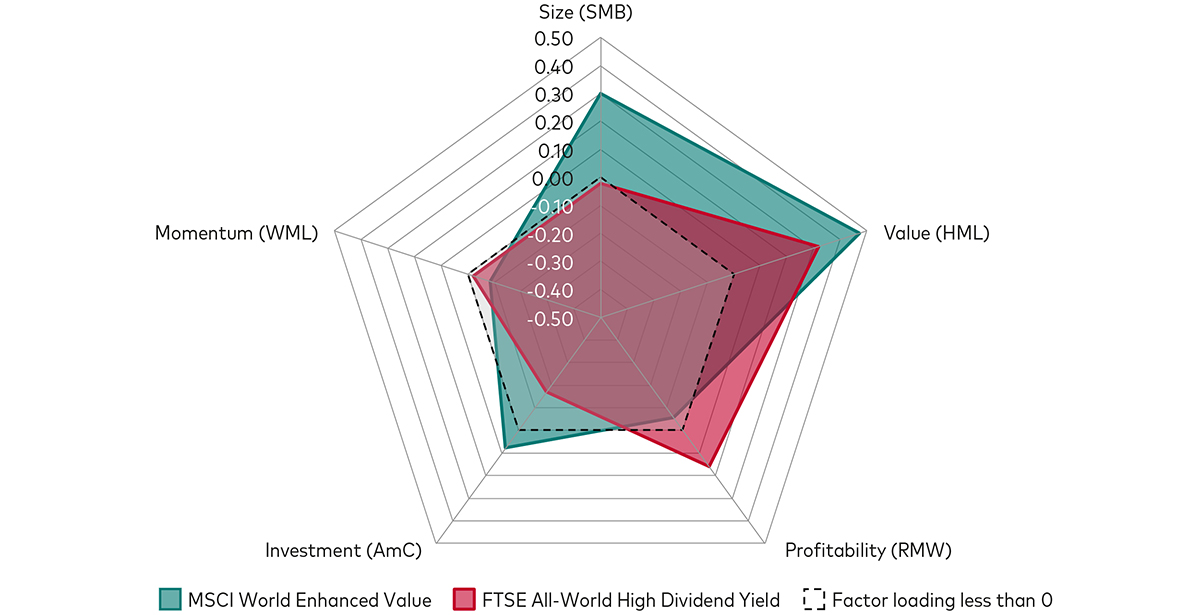
For investors who are considering implementing a high-dividend strategy as part of their asset allocation, the FTSE All-World High Dividend Yield Index offers a robust, forward-looking approach to screening and selecting high dividend-yielding stocks. The methodology behind the index harnesses value and quality without sacrificing diversification, a distinct characteristic versus conventional and more concentrated dividend exposures, which may focus more on value. In fact, more than two decades of performance history demonstrates the “value without value traps” proposition inherent in the exposure throughout major stock market cycles and recessions, as the chart below shows (where quality is labelled as profitability).
Long-term dividend investing relies on a balance between value and quality
Factor loadings comparison: FTSE All-World High Dividend Yield Index and MSCI World Enhanced Value Index

Past and back-tested performance is not a reliable indicator for future results.
Source: Bloomberg, Fama & French Data Library, Vanguard. Data from 31 October 2000 to 31 March 2024, using monthly net total returns in USD and the longest joint live data history available as of the inception on 31 March 2008 of the FTSE All-World High Dividend Yield Index. Data used for the index prior to inception is back-tested. Factor loadings of FTSE All-World High Dividend Yield and MSCI World Enhanced Value are based on regressions of their excess returns over parent indices (FTSE All-World and MSCI World, resp.) on returns of Fama and French developed markets factor portfolios. For more information, please refer to Fama & French Data Library. Note: Investment (AmC) is the inverse interpretation of Fama & French’s investment factor (Conservative minus Aggressive, or CmA). T-values of the Value and Profitability coefficients for FTSE All-World High Dividend Yield and MSCI World Enhanced Value are statistically significant at a 5% confidence interval.
Value and quality (labelled as “profitability” in the chart) are the FTSE exposure’s dominant factor loadings and underscore that its long-term performance is led by fundamentals rather than sentiment. In other words, when periods of value outperforming growth coincide with high-quality (profitable) outperforming poor-quality (unprofitable) stocks, the index tends to outperform the broader market5. The converse also tends to be true, that when periods of value underperforming growth coincide with high quality underperforming poor-quality stocks, the index often underperforms the broader market.
By contrast, an alternative, concentrated value-focused exposure can set up investors to capture stocks trading at low valuation multiples and high dividend yields because of depressed prices, rather than strong earnings and dividends So-called “value traps,” these stocks thrive on sentiment without sound fundamental support, for example when a low interest rate environment poses less of a concern for companies exhibiting poor profitability. In such a case, the value factor driving the strategy’s performance relies on poor-quality equities to outperform higher-quality peers.
The FTSE All-World High Dividend Yield Index methodology is forward-looking and constructed in a considered way. It screens stocks globally—including emerging markets—by their 12-month forward dividend yield, selecting the highest-yielding stocks that combined make up 50% of the dividend-paying universe’s market capitalisation. Weighting by market cap neutralises the bias towards higher-dividend-yielding stocks, as size tends to gravitate towards stocks that reinvest more than distribute profits. To that effect, the final basket of stocks will, at the margin, diversify into dividend growers to complement high dividend yielders.
1 In our context, Magnificent 7 refers to the companies Alphabet, Amazon, Apple, Meta Platforms, Microsoft, Nvidia and Tesla.
2 Source: Bloomberg, as of 27 June 2024. At the time of writing, the S&P 500 Index had returned 15% and Apple had returned 11%.
3 See: Shiller, Robert J., Irrational Exuberance, Princeton University Press, 2000, 2005, 2015.
4 Past performance is not a reliable indicator of future returns. Source: Robert J. Shiller, with stock market data used in "Irrational Exuberance" Princeton University Press, 2000, 2005, 2015, Bloomberg. Data from 30 September 1922 to 31 March 2024, in US dollars. DPS = dividends per share, EPS = earnings per share and are for the S&P 500 index. Performance adjusted for inflation i = the rate of change adjusted for the US Urban Consumer Price Index (CPI).
5 The broader market references the FTSE All-World Index, which is the parent index of the FTSE All-World High Dividend Yield Index.
Related funds
Investment risk information
The value of investments, and the income from them, may fall or rise and investors may get back less than they invested.
Past performance is not a reliable indicator of future results.
Simulated past performance is not a reliable indicator of future results.
Performance figures shown may be calculated in a currency that differs from the currency of the share class that you are invested in. As a result, returns may decrease or increase due to currency fluctuations.
Some funds invest in securities which are denominated in different currencies. Movements in currency exchange rates can affect the return of investments.
Important information
For professional investors only (as defined under the MiFID II Directive) investing for their own account (including management companies (fund of funds) and professional clients investing on behalf of their discretionary clients). In Switzerland for professional investors only. Not to be distributed to the public.
The information contained herein is not to be regarded as an offer to buy or sell or the solicitation of any offer to buy or sell securities in any jurisdiction where such an offer or solicitation is against the law, or to anyone to whom it is unlawful to make such an offer or solicitation, or if the person making the offer or solicitation is not qualified to do so. The information does not constitute legal, tax, or investment advice. You must not, therefore, rely on it when making any investment decisions.
The information contained herein is for educational purposes only and is not a recommendation or solicitation to buy or sell investments.
Issued in EEA by Vanguard Group (Ireland) Limited which is regulated in Ireland by the Central Bank of Ireland.
Issued in Switzerland by Vanguard Investments Switzerland GmbH.
Issued by Vanguard Asset Management, Limited which is authorised and regulated in the UK by the Financial Conduct Authority.
Issued in EEA by Vanguard Group Europe Gmbh, which is regulated in Germany by BaFin.
© 2024 Vanguard Group (Ireland) Limited. All rights reserved.
© 2024 Vanguard Investments Switzerland GmbH. All rights reserved.
© 2024 Vanguard Asset Management, Limited. All rights reserved.
© 2024 Vanguard Group Europe GmbH. All rights reserved.
