- During periods of uncertainty, clients often look to their financial advisers for their financial and emotional wellbeing.
- It is during these times that advisers can add tremendous value for their clients by helping them to tune out the short-term noise.
- Advisers can help reinforce how, given a long-term investment horizon, volatility is not an abstract event but a normal part of investing.
“A diversified portfolio allows investors to benefit from the gains of the best-performing assets without having to guess where those gains will come from or the risk of being invested in the wrong place.”
Senior Specialist, Advisory Research Centre, Vanguard Europe

As market pullbacks and volatility dominate headlines, many clients are looking to their financial advisers for guidance. We have long maintained that periods of uncertainty, like those we’ve seen so far in 2025, are the “moments that matter”.
It is during these times that advisers can add tremendous value for their clients through behavioural coaching helping clients tune out short-term market noise and focus on their long-term investment goals.
Help clients put market volatility in context
Investing can be emotionally challenging for clients, especially when their portfolio balances decline. During such times, it’s important to remind them that volatility is a natural and expected part of investing.
Consider these charts:
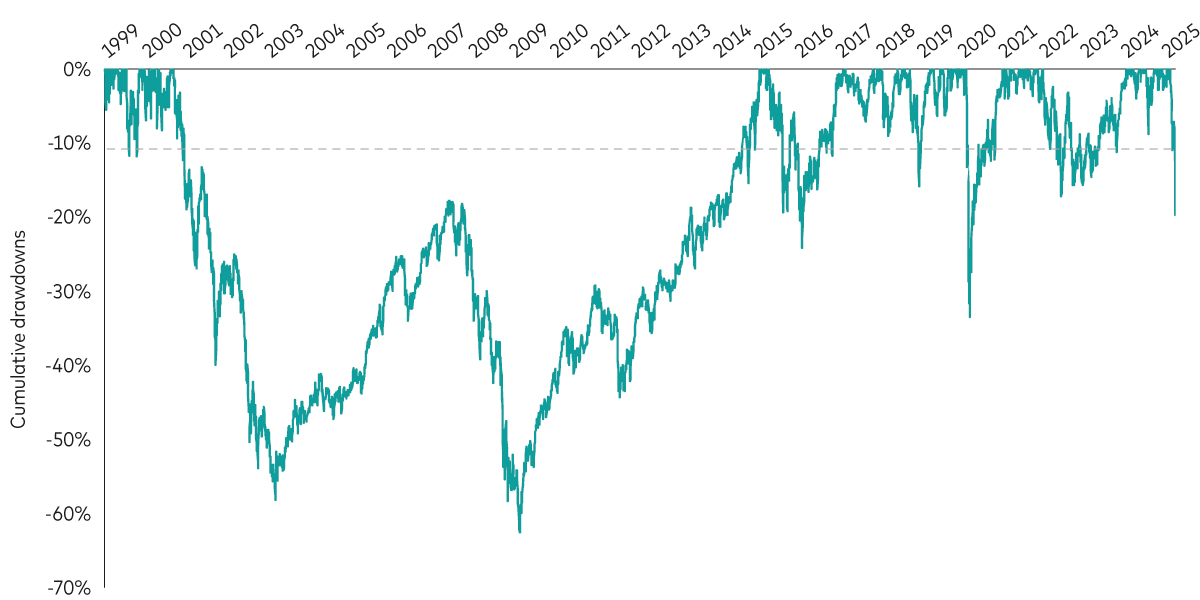
- Figure 1 shows global equity market drawdowns since 1999. What can be seen is the substantial proportion of time that the market has been meaningfully below its historical peak.
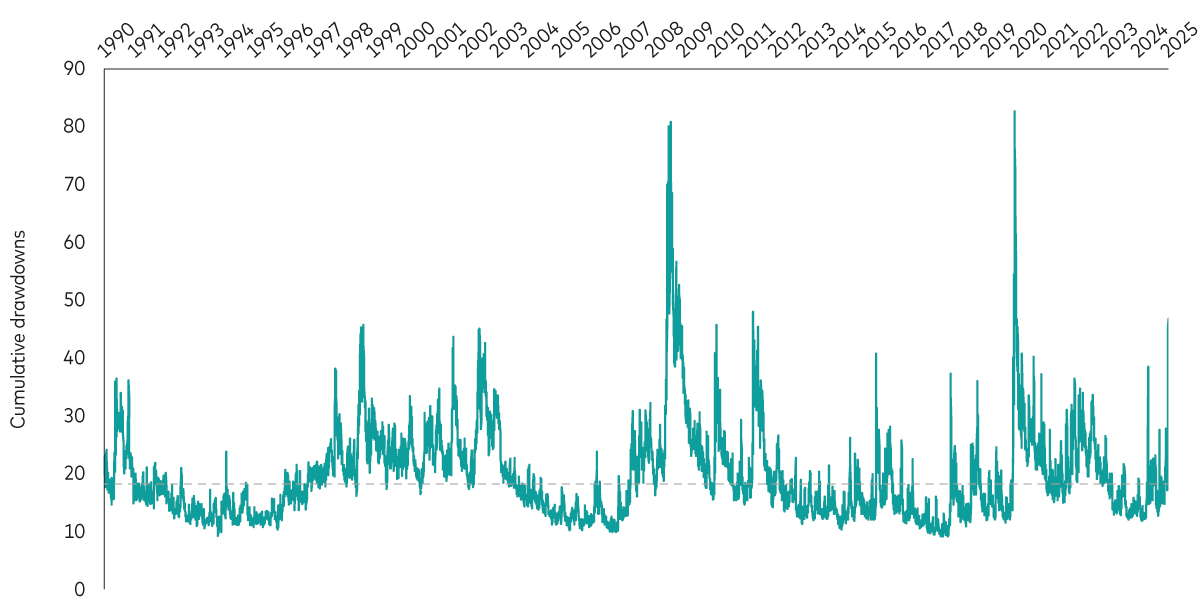
- Figure 2 shows the Chicago Board Options Exchange's (CBOE) VIX Index which measures expected market volatility.
Pairing these two charts highlights that, despite the recent pullback, expected market volatility is not substantially higher than we’ve seen historically. Sharing this type of information with your clients can help them tune out the noise and remain committed to their long-term financial goals.
Figure 1: Global equity market drawdowns (January 1999–April 2025)
Past performance is not a reliable indicator of future results.
Notes: Equities represented by the FTSE All World Index in EUR from 1 January 1999 through to 8 April 2025.
Source: Vanguard Investment Advisory Research Centre using data as at 8 April 2025.
Figure 2: Daily CBOE VIX Index (January 1990–April 2025)
Source: Vanguard Investment Advisory Research Centre using data from CBOE, as at 8 April 2025.
Use historical returns to provide more context
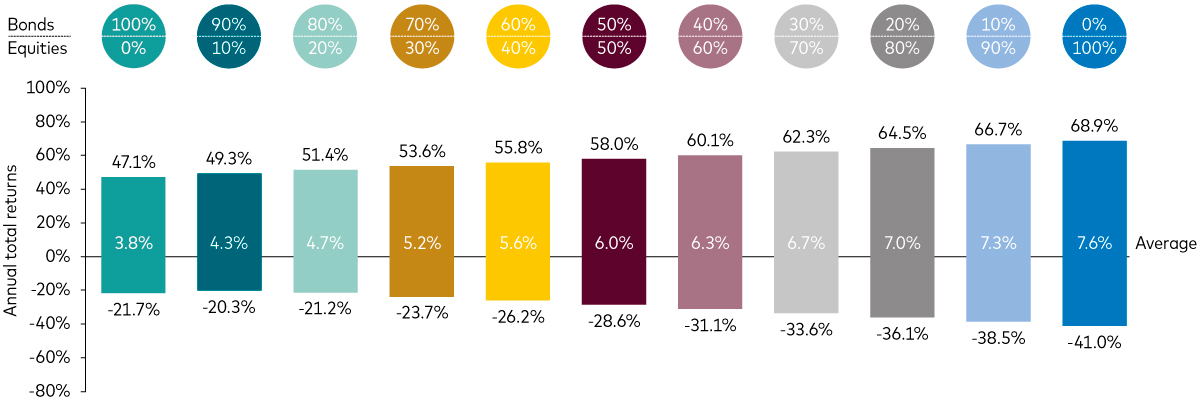
Figure 3 captures the distribution of calendar-year returns across different asset allocations, from 100% bonds to 100% equities.
Figure 3: The mixture of assets defines the spectrum of returns
Past performance is not a reliable indicator of future results.
Notes: Reflects the maximum and minimum calendar year returns, along with the average annualised return, from 1901-2024, for various stock and bond allocations, rebalanced annually. Stock returns are represented by the DMS World Equity Total Return Index from 1901 to 1969, and the MSCI World Total Return Index (EUR) thereafter. Bond returns are represented by the DMS World Bond Total Return Index from 1901 to 1999, and the Bloomberg Global Aggregate Index (Euro hedged) thereafter. Returns are in Euros (Deutsche mark prior), with income reinvested to 31 December 2024.
Source: Vanguard.
- Advisers can use historical returns to help clients understand current market performance and set reasonable risk and return expectations for their portfolios.
- It is helpful for advisers to remind clients that market volatility is not an abstract event.
- Advisers can help reinforce how, with a long-term investment horizon, we should expect to see higher highs and lower lows than what we have seen in the past.
The power of diversification
Diversification remains crucial in 2025, as Figure 3 underscores. Our fixed income team’s perspectives highlight the
- opportunities in fixed income; and the
- role fixed income plays in a broadly diversified portfolio aligned with clients’ long-term investment goals.
The 2022 bond market sell-off was challenging for fixed income investors and may still be fresh in many of your clients’ minds. However, it might help to remind them that current starting yields are higher, providing them with a “coupon wall”. This implies that, compared with a few years ago, future bond returns are less likely to be affected by minor interest rate increases.
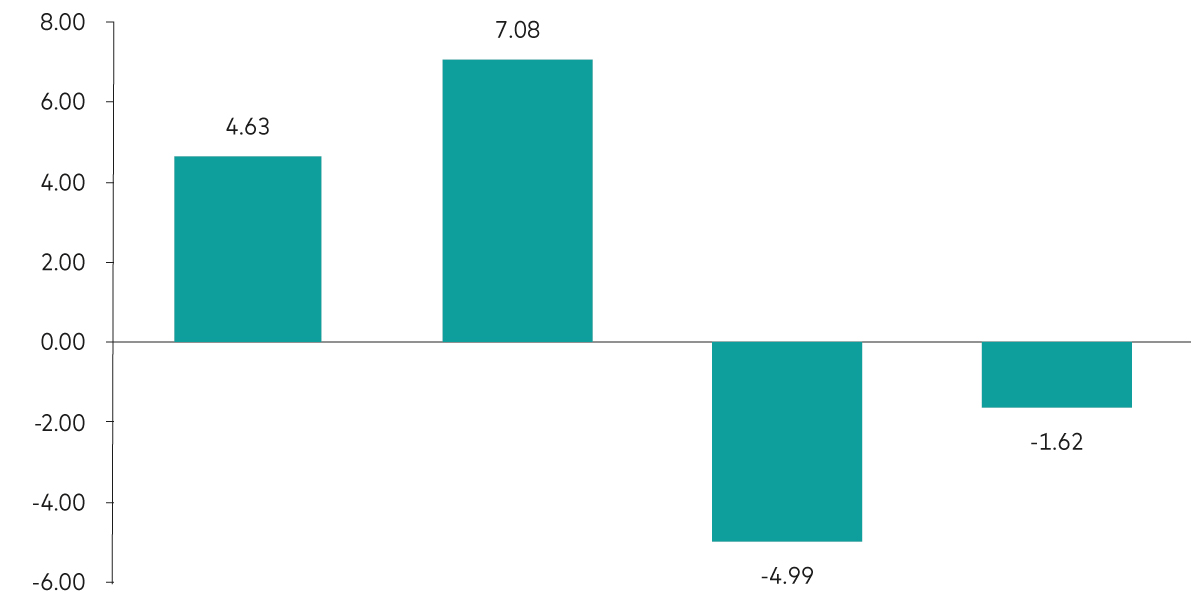
History has taught us that it’s hard to predict rate changes. But even a sudden 50 basis point (bps) change in interest rates (in either direction) is likely to still leave clients better off one year on, as shown in Figure 4. This chart compares the forward one-year total returns for an on-the-run 10-year German bund after a 50 bps increase or decrease in interest rates in the current market and at the end of 2021, when starting bond yields were much lower. As the chart shows, the higher starting yield on bonds today leads to the dual benefits of:
- a higher total return if rates decrease (the positive effect of capital appreciation and the higher yield are combined); and
- a yield buffer (due to the higher starting yield) if rates increase (the higher starting yield helps offset the capital depreciation).
Figure 4: Effect of a 50 basis point change in rates on 10-year German bunds’ 1-year total returns
Past performance is not a guarantee of future returns. The performance of an index is not an exact representation of any particular investment, as you cannot invest directly in an index.
Notes: Modified duration calculated as at 31 December 2021 and 1 March 2025 using 10-year German bunds. Changes in rates assumed to impact the price of the bonds immediately and assumes that the change in rates is the same across the entire yield curve.
Source: Vanguard Investment Advisory Research Centre calculations using data from Bloomberg.
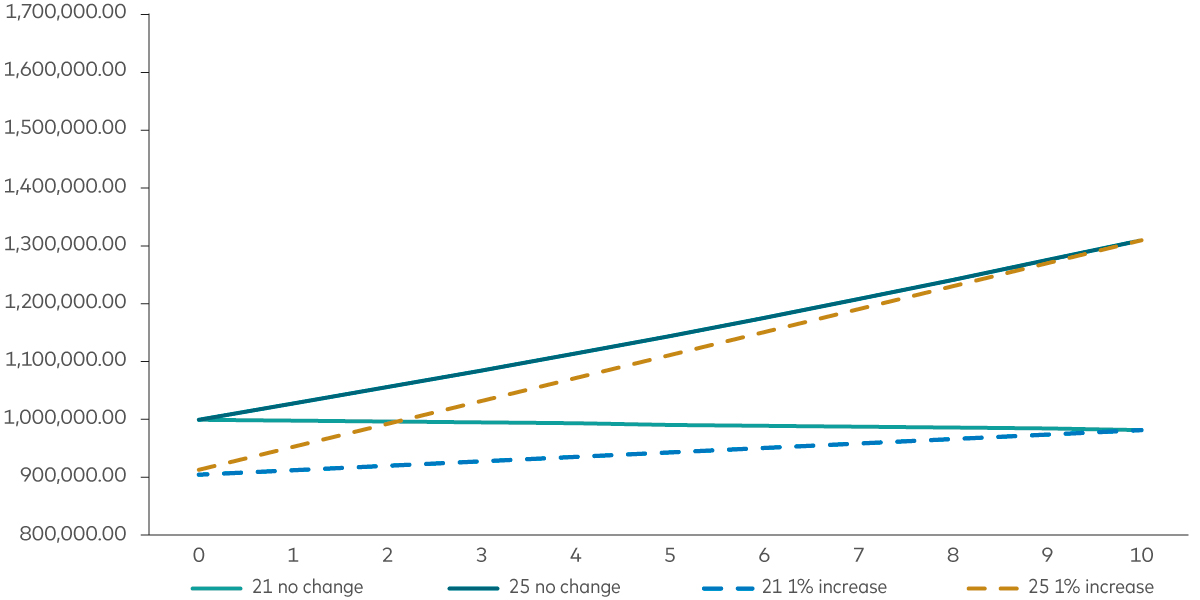
Figure 5 also highlights that while a sudden increase in rates of 50 bps would cause similar negative initial price moves, the current higher yield on 10-year German bunds would overcome that price loss in less than a year, which is significantly faster than a few years ago.
Figure 5: Effect of a 50 basis point increase in rates on 10-year German bunds now versus three years ago
Past performance is not a guarantee of future returns. The performance of an index is not an exact representation of any particular investment, as you cannot invest directly in an index.
Notes: Modified duration calculated as at 31 December 2021 and 1 March 2025 using 10-year German bunds. Changes in rates assumed to impact the price of the bonds immediately and assumes that the change in rates is the same across the entire yield curve.
Source: Vanguard Investment Advisory Research Centre calculations using data from Bloomberg.
Diversification extends beyond fixed income. There will always be an asset class, sector or security that will perform more strongly than others. But predicting these trends ahead of time is very difficult and almost impossible to do consistently. A diversified portfolio allows investors to benefit from the gains of the best-performing assets without having to guess where those gains will come from or the risk of being invested in the wrong place.
That’s why we believe a global market-cap portfolio of equities and bonds is a great starting point. Depending on an investor’s preferences and risk tolerance, models and assessments of valuation differences can offer potential ways to adjust this portfolio over time.
Adviser’s Alpha is enduring
Our Adviser’s Alpha research has shown that periods of uncertainty and capital losses are the “moments that matter” for advisers and “Adviser’s Alpha weather”. In times of stress, clients often look to their financial advisers as guardians of their financial and emotional well-being. For advisers who are looking to positively communicate with clients during periods of uncertainty, behavioural coaching helps clients to tune out the noise. By integrating these principles, advisers can foster stronger client relationships, reduce stress and enhance long-term investment success.
Investment risk information
The value of investments, and the income from them, may fall or rise and investors may get back less than they invested.
Important information
For professional investors only (as defined under the MiFID II Directive) investing for their own account (including management companies (fund of funds) and professional clients investing on behalf of their discretionary clients). In Switzerland for professional investors only. Not to be distributed to the public.
The information contained herein is not to be regarded as an offer to buy or sell or the solicitation of any offer to buy or sell securities in any jurisdiction where such an offer or solicitation is against the law, or to anyone to whom it is unlawful to make such an offer or solicitation, or if the person making the offer or solicitation is not qualified to do so. The information does not constitute legal, tax, or investment advice. You must not, therefore, rely on it when making any investment decisions.
The information contained herein is for educational purposes only and is not a recommendation or solicitation to buy or sell investments.
Issued in EEA by Vanguard Group (Ireland) Limited which is regulated in Ireland by the Central Bank of Ireland.
Issued in Switzerland by Vanguard Investments Switzerland GmbH.
Issued by Vanguard Asset Management, Limited which is authorised and regulated in the UK by the Financial Conduct Authority.
© 2025 Vanguard Group (Ireland) Limited. All rights reserved.
© 2025 Vanguard Investments Switzerland GmbH. All rights reserved.
© 2025 Vanguard Asset Management, Limited. All rights reserved.

