- There are numerous considerations when selecting an equity index exposure, including the choice between market-cap or equal-weighted methodologies.
- While each approach has its potential benefits and drawbacks, the most important thing for investors to understand is what they own and how it fits in their portfolio.
- In our view, the areas that investors should analyse are the cost implications and the differences in exposure that result from the two approaches.
"Equal-weighting changes the risks – it doesn’t remove them."
Head of Index Equity and ETF Product Specialism, Vanguard Europe

When it comes to investing in the equity market via an index fund or ETF, an important consideration is the index weighting methodology. Two common approaches are market-capitalisation weighting and equal weighting. The market-cap-weighted approach provides “passive” exposure to the targeted market by weighting all of its assets in accordance with their capitalisation – hence, it resembles the market itself. It has been around for many years and is the better established of the two.
The equal-weighted approach, on the other hand, holds the same securities but weights them equally. Relative to the market, it is more of an active strategy as it contains relative risk – most obviously because it underweights large-cap stocks and overweights small-cap stocks. This approach tends to see periodic increases in popularity—for example, when investors are concerned that a subset of the market, such as an industry—may take up too much of the total.
While there are benefits to either approach, investors should ensure they understand what each means in terms of costs, risks and ultimately the investment exposure. Here, we explain the basic mechanics of each approach and why we believe that a market-cap-weighted index could be the better option for many investors seeking broad equity exposure, looking at US equities in particular.
The basics: Market-cap-weighted versus equal-weighted indices
A market-cap-weighted index assigns weights to constituent securities based on their (free-float) market capitalisation1. This means that more highly capitalised (or larger-cap) companies have a greater influence on index performance. The S&P 500 Index and the Russell 3000 are well-known examples of market-cap-weighted indices.
The advantages of such an approach include:
- Representation of the market: Market-cap-weighting is not so much “another weighting approach” but rather the neutral representation of a given market segment itself. As such, one may argue that it is the best representation of the dynamics of the underlying segment as the weights of its constituents are aligned with their “economic importance”.
- Liquidity and trading volume: The shares of more highly capitalised companies frequently exhibit more favourable liquidity characteristics, which makes them less expensive to trade. Hence, allocating relatively more capital to large caps can reduce transaction costs and improve the efficiency of index tracking.
- Less turnover: Compared with equal-weighted indices, market-cap-weighted indices are relatively more straightforward to replicate. If the capitalisation of one company grows while that of another declines over time, so do their weights in the index – no adjustment is necessary.
The potential drawbacks to keep in mind include:
- Concentration: When individual stocks or industries account for a large part of the market, the characteristics of market-cap-weighted indices can be significantly driven by these subsets. In a scenario where such companies or industries suddenly decline more in value than the rest of the market, market-cap weighting would underperform an equal-weighted approach. However, our research has shown that large companies can make an important positive contribution to returns in the longer term.
- Lower exposure to smaller companies: If smaller companies outperform larger companies, market-cap weighting would underperform equal weighting as the latter approach would have allocated relatively more weight to smaller firms.
An equal-weighted index, meanwhile, assigns the same weight to each constituent security, regardless of its market capitalisation. A common example of an index that uses this methodology is the S&P 500 Equal Weight Index.
Advantages of an equal-weighted approach typically include:
- Lower concentration in individual stocks: At times when single industries are relatively more highly capitalised than others, equal weighting may reduce the dependence of the index’s characteristics on that industry.
- Diversification across the capitalisation spectrum: Relative to market-cap-weighted indices, equal-weighted indices overweight mid- and small-cap companies. Thus they offer a more balanced exposure to the different size segments of the underlying market.
The most important downsides to the approach are:
- Relative risk: Many investors tend to compare the performance of their investment with that of the “market”. At times when equal-weighted indices underperform the market (hence, the cap-weighted alternative), such investors may divest and fail to benefit from the positive expected returns of equity markets over the long term.
- Volatility: Equal-weighted indices can be more volatile than market-cap-weighted indices, as they are more sensitive to the performance of smaller companies – which tend to have higher volatilities than large-cap companies.
- Higher turnover and transaction costs: Equal-weighted indices require regular rebalancing to maintain equal weights, which can result in higher turnover and transaction costs than market-cap-weighted equivalents. Indeed, the more frequent the rebalancing, the greater the cost implications. Our research has shown that, over the past 10 years, the S&P 500 equal-weight index had on average more than five times the two-way turnover of the S&P 500 market-weight index2.
Even though it is not an outright downside, but rather a practical necessity, it is important to point out that the weights of companies included in an equal-weighted index are equal only at each rebalance. For example, an index with a quarterly rebalance is equally weighted only four times per year; depending on the stock price movements of its constituents, weights can increase or decrease over the course of the subsequent quarter. And keep in mind, rebalancing more frequently would translate into higher costs for the investor.
Exposure analysis: Equal-weighting changes the risks – it doesn’t remove them
Some investors might consider the equal-weighted approach as a way to mitigate against concentration risk. For these investors, it is important to understand that switching from a cap-weighted index to an equal-weight index does not eliminate risk, it just shifts the sources of risk an investor faces.
For illustrative purposes, we compare the S&P 500 and the Russell 3000 indices (market-cap-weighted) with their equal-weighted counterparts. It should be noted that all of these indices do provide broad exposure to the US equity universe. Digging beneath the surface, however, we find a range of important differences.
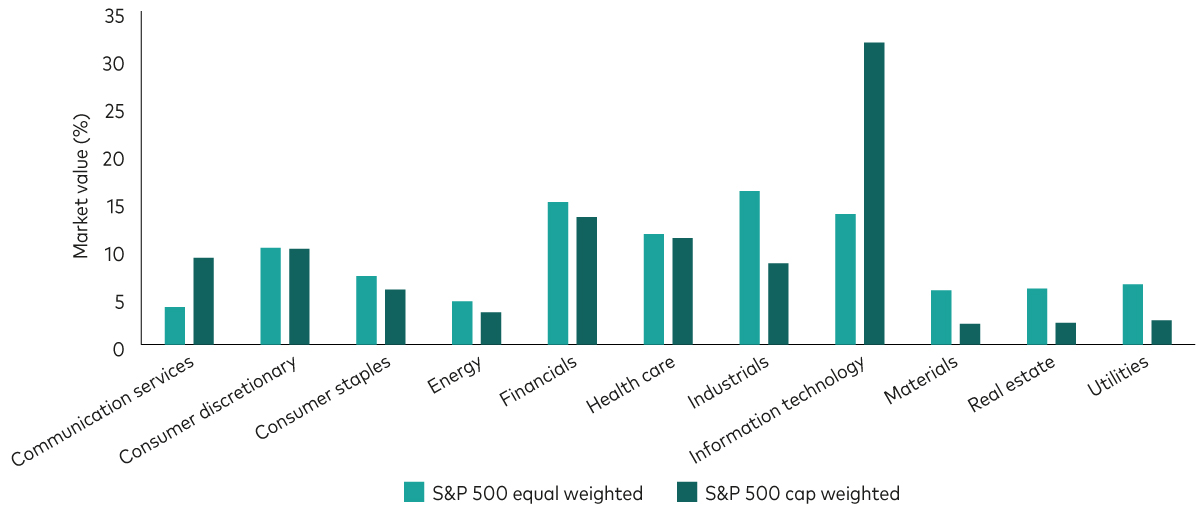
If the aim of equal weighting were to, say, reduce exposure to the information technology sector, we find that the approach achieved its objective (as the chart below for the S&P 500 illustrates). However, the price of achieving this objective is active risk relative to the market. While IT is underweight, other sectors—such as industrials, materials, real estate and utilities—are almost double their weight in the market. Whenever an overweighted sector under- or outperforms in relative terms, the equal-weighted index under- or outperforms the market (i.e., its cap-weighted equivalent).
Sector breakdown: There are important differences between index-weighting approaches

Source: Bloomberg, as of 11 December 2024. Chart shows sector compositions of S&P 500 Equal Weight Index and the S&P 500 Index (weighted by market cap).
Active factor risk with equal weighting
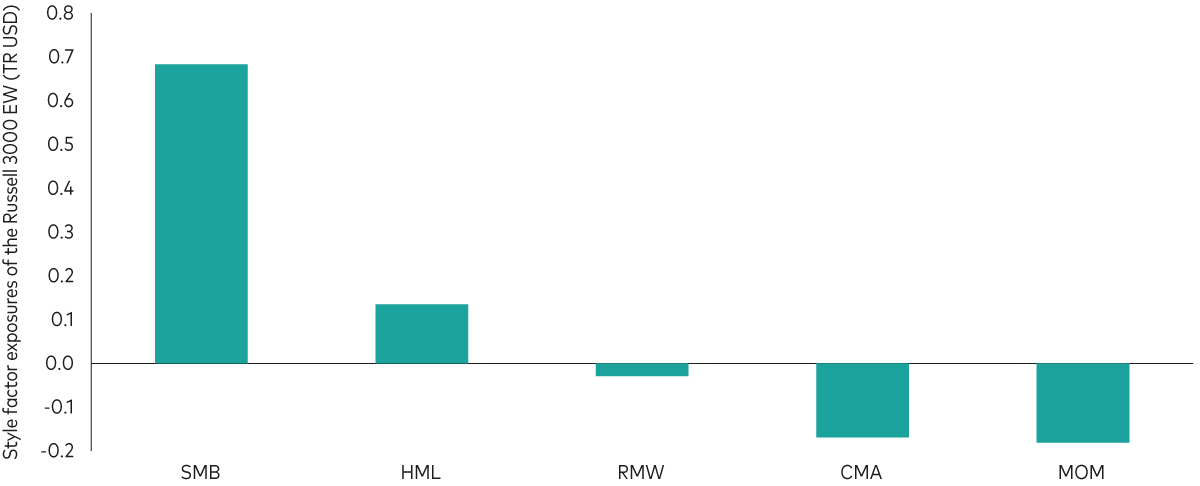
As well as exposing investors to active risk as a result of deviations in sector weights, equal weighting also leads to active factor risk. To demonstrate this, we have analysed the Russell 3000 Equal Weighted TR USD, an index that contains the majority of US companies3. The figure below shows the exposures of the Russell 3000 equal-weighted index relative to the cap-weighted US equity market itself (represented by the Russell 3000 index, market-cap weighted).
As mentioned above, equal weighting leads to a significant tilt towards small-cap companies. But our analysis also reveals significant tilts towards other factors, such as a positive exposure to value and a negative exposure to momentum. Therefore, if value stocks under- or outperform relative to growth stocks, the equal-weighted index under- or outperforms. Similarly, if momentum performs well/poorly, the equal weighting under- or outperforms cap weighting (all else being equal).
Style factor exposures of the Russell 3000 Equal Weighted TR USD index

Notes: Regressions are run based on monthly total returns in USD observed over the course of January 2000 to June 2024, using data provided by Morningstar. Style factor returns are taken from Kenneth French’s website. The market factor is represented by the returns of the Russell 3000 Index (market-cap weighted). Definitions: SMB (small minus big) is the average return on the three small portfolios minus the average return on the three big portfolios; HML (high minus low) is the average return on the two value portfolios minus the average return on the two growth portfolios; RMW (robust minus weak) is the average return on the two robust operating profitability portfolios minus the average return on the two weak operating profitability portfolios; CMA (conservative minus aggressive) is the average return on the two conservative investment portfolios minus the average return on the two aggressive investment portfolios; MOM (momentum) is the average return on the two high prior return portfolios minus the average return on the two low prior return portfolios.
Source: Morningstar, Vanguard.
If investors chose an equal-weighted (rather than a cap-weighted) index with the objective to outperform the cap-weighted counterpart, the choice makes sense only if the factors to which the equal-weighted index is exposed perform in the right direction. In the short run, this may be overweighted sectors that perform well or underweighted sectors that perform poorly. In the long run, that may be small-cap stocks that outperform large-cap stocks or value stocks that outperform growth.
It may well be that these active views at times pay off. However, investors need to be aware that such active “bets” may not pay off as these factors could perform in a different direction than anticipated – in which case, equal weighting may underperform market-cap weighting.
For investors who are considering investing in an equal-weighted fund with the objective to add a specific style exposure to their portfolio, they may be better off investing directly in a fund that explicitly targets the style, such as a small-cap index fund.
Furthermore, for investors seeking equity exposure that reflects a targeted market in a passive (that is, active risk-neutral) way, a cap-weighted index is the appropriate approach. As mentioned above, the inherent cost advantage afforded by the cap-weighted approach means it is better suited for long-term investors, given the negative impact that higher costs can have when compounded over time.
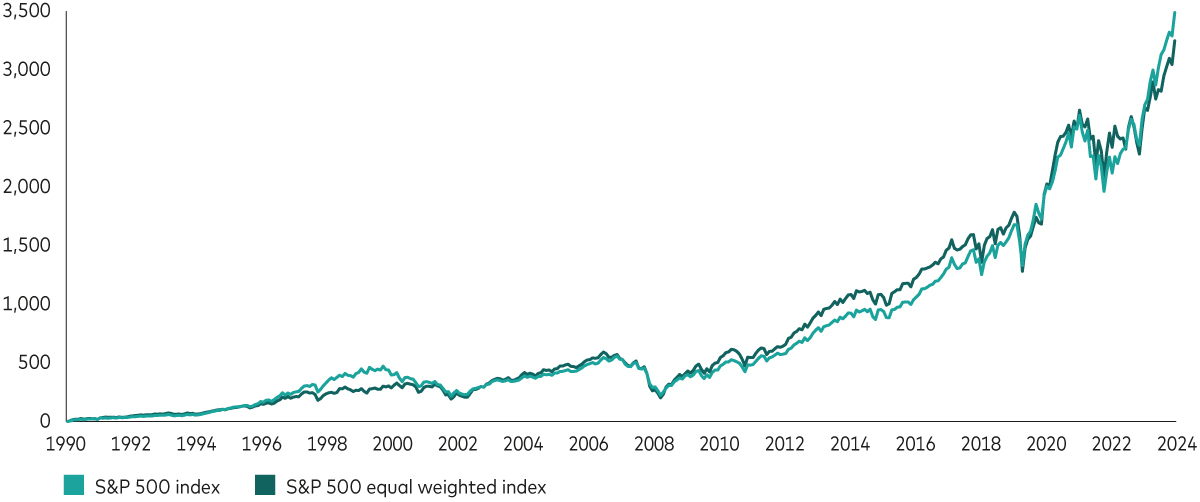
Performance comparison: S&P 500 Index (cap-weighted, SPX) vs. S&P 500 Equal Weight Index (SPW)

Past performance is not a reliable indicator of future results. The performance of an index is not an exact representation of any particular investment, as you cannot invest directly in an index.
Source: Bloomberg, with data showing the period 31 January 1990 (the inception date of the equal-weighted index) to 31 October 2024.
1 Market capitalisation is calculated as the share price of a company multiplied by the number of shares outstanding. To increase the tradability of the index, only the portion of shares that are considered by the index provider to be available for purchase and not be held for the very long term (the so called free-float) is taken into account in most cases.
2 Source: S&P Dow Jones Indices, as of 29 November 2024.
3 We use the Russell 3000 rather than the S&P 500 index for the factor analysis as the S&P 500 index would display a tilt towards large cap not because of market-cap weighting but because of the fact that it only contains the largest 500 stocks of the US equity market.
Relevant ETFs
Investment risk information
The value of investments, and the income from them, may fall or rise and investors may get back less than they invested.
Past performance is not a reliable indicator of future results. The performance data does not take account of the commissions and costs incurred in the issue and redemption of shares.
Important information
For professional investors only (as defined under the MiFID II Directive) investing for their own account (including management companies (fund of funds) and professional clients investing on behalf of their discretionary clients). In Switzerland for professional investors only. Not to be distributed to the public.
The information contained herein is not to be regarded as an offer to buy or sell or the solicitation of any offer to buy or sell securities in any jurisdiction where such an offer or solicitation is against the law, or to anyone to whom it is unlawful to make such an offer or solicitation, or if the person making the offer or solicitation is not qualified to do so. The information does not constitute legal, tax, or investment advice. You must not, therefore, rely on it when making any investment decisions.
The information contained herein is for educational purposes only and is not a recommendation or solicitation to buy or sell investments.
Issued in EEA by Vanguard Group (Ireland) Limited which is regulated in Ireland by the Central Bank of Ireland.
Issued in Switzerland by Vanguard Investments Switzerland GmbH.
Issued by Vanguard Asset Management, Limited which is authorised and regulated in the UK by the Financial Conduct Authority.
© 2025 Vanguard Group (Ireland) Limited. All rights reserved.
© 2025 Vanguard Investments Switzerland GmbH. All rights reserved.
© 2025 Vanguard Asset Management, Limited. All rights reserved.