- Investors should tune out the noise during election periods and stick to their long-term investment strategy.
- Historically, elections have had minimal impact on stock market performance.
- Even in the months immediately before and after the vote, US stocks have typically been calm relative to history.
As the US presidential election unfolds, commentators worldwide are closely monitoring the potential implications for financial markets. However, historical data suggests that while elections can stir emotions, they do not significantly impact short-term dynamics in stock markets.
Elections in major economies tend to lead to speculation about what one result might mean compared to another. In some cases, clients may be concerned about the implications of an election result for their investment portfolio.
While US presidential elections are significant and historically important events, election outcomes have little influence on markets. Our research shows that stock market volatility in the build-up and in the immediate aftermath of US presidential elections has historically been minimal—irrespective of the result.
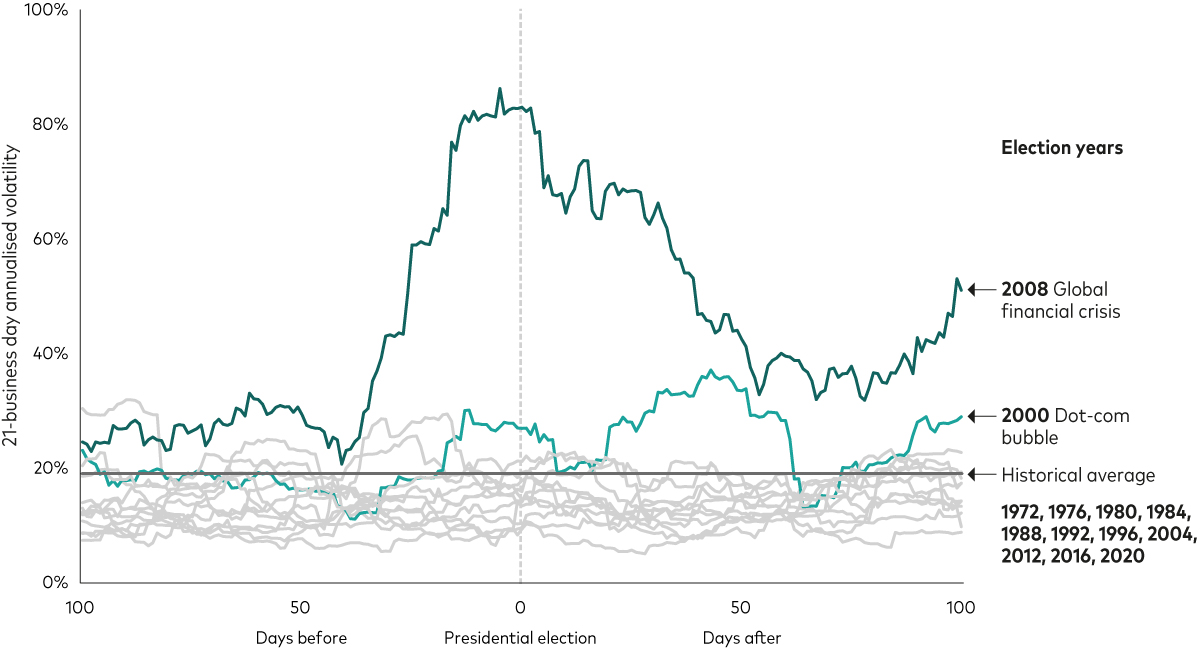
The chart below shows US stock market volatility in the 100 business days leading up to and following each of the 13 presidential elections since 1972. The grey line shows the annualised volatility of the S&P500 since 1971. For most elections (the grey lines) volatility is lower than the historical average. The major exceptions are the 2000 and 2008 elections, which coincided with the collapse of the dot-com bubble (turquoise line) and the global financial crisis (dark green line).
Votes and volatility: US stocks in the months closest to the vote

Past performance is not a reliable indicator of future results. The performance of an index is not an exact representation of any particular investment, as you cannot invest directly in an index.
Notes: The chart shows the annualised volatility of daily S&P 500 returns in EUR, measured over the previous month (21 business days) at each business day starting 100 days before and ending 100 days after US presidential elections since November 1972. Volatility is a measure of how much the daily returns varied over time. The grey line shows the average annualised volatility between 20 August 1971 and 27 September 2024. Returns do not include the impact of fees.
Source: Vanguard calculations in EUR, based on data from Refinitiv, as at 4 October 2024.
While the volatility in 2008 subsided following the November election that year, the trend is more coincidence than correlation. The 2008 US presidential election campaign broadly coincided with the build up of the global financial crisis, which accelerated in September 2008 with the collapse of Lehman Brothers—just over 30 business days before the election.
The key message for investors is that markets are forward-looking and prices efficiently reflect expectations for different events, be it economic factors or political outcomes. There is a large range of factors that influence market performance and presidential elections are rarely the principal driver.
Markets tend to ignore presidential election years
If we zoom out and look at longer-term market performance, it’s clear that US elections have been of little consequence to market returns.
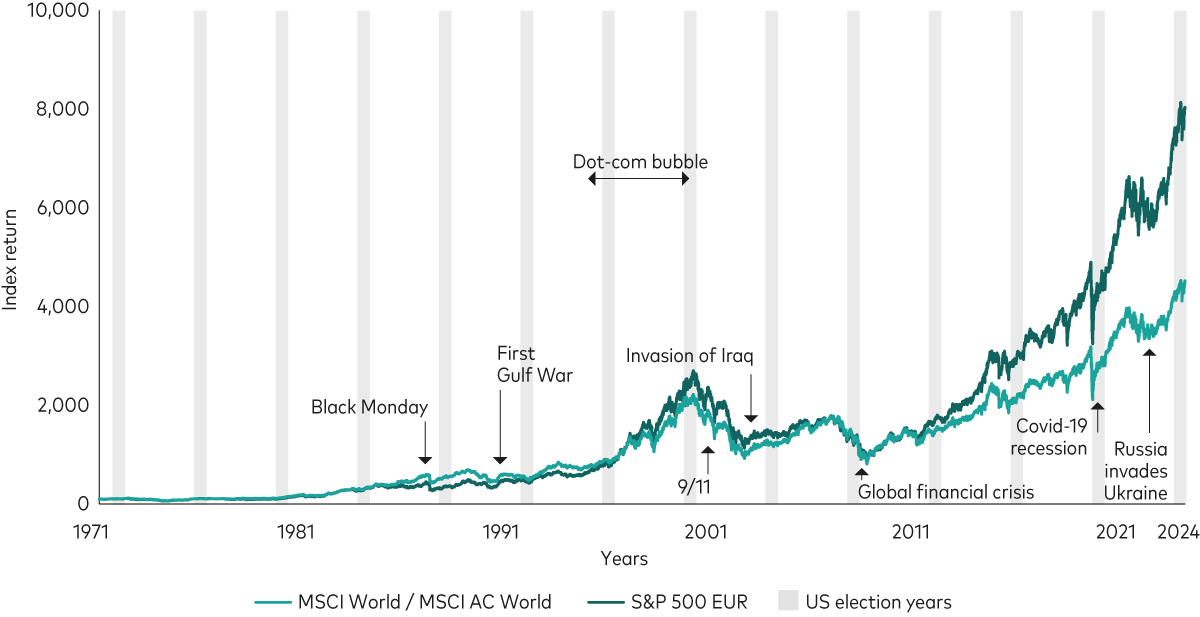
The chart below shows the performance of US and global stock markets between August 1971 and September 2024. During that time, there have been 14 presidential election years, including 2024 ahead of November’s vote. The grey bars signal election years in the US and it’s clear that long-term market returns have little to do with election outcomes.
The events that impacted stock markets the most during that time period were of a much bigger scale. These included the bursting of the dot-com bubble and the global financial crisis in 2007-09. Stock markets eventually recovered from these major, global events and went on to reach new highs.
Stock market performance from 1971 to 2024

Past performance is not a reliable indicator of future results. The performance of an index is not an exact representation of any particular investment, as you cannot invest directly in an index.
Notes: The chart shows the price of global equities (measured by the MSCI World Price Index from until 31 December 1987 and the MSCI AC World Price Index thereafter) and US equities (measured by the S&P 500 Price Index) in EUR from 20 August 1971 to 27 September 2024. Returns do not include the impact of fees. The shaded vertical lines show the US election years. Both indices were rebased so that 20 August 1971 equals 100.
Source: Vanguard calculations in EUR, based on data from Refinitiv, as at 4 October 2024.
Look beyond the ballot
Presidential elections generate lots of headlines, but they should not sway investors to change their financial plans. It's understandable to have concerns about an election but, as far as portfolios and the markets are concerned, history suggests they are a non-issue.
Help clients tune out the noise and maintain a long-term perspective to keep them on track to meet their financial goals and avoid any emotionally-driven portfolio decisions.
Investment risk information
The value of investments, and the income from them, may fall or rise and investors may get back less than they invested.
Past performance is not a reliable indicator of future results.
Important information
This is a marketing communication.
For professional investors only (as defined under the MiFID II Directive) investing for their own account (including management companies (fund of funds) and professional clients investing on behalf of their discretionary clients). Not to be distributed to the public.
The information contained herein is not to be regarded as an offer to buy or sell or the solicitation of any offer to buy or sell securities in any jurisdiction where such an offer or solicitation is against the law, or to anyone to whom it is unlawful to make such an offer or solicitation, or if the person making the offer or solicitation is not qualified to do so. The information does not constitute legal, tax, or investment advice. You must not, therefore, rely on it when making any investment decisions.
The information contained herein is for educational purposes only and is not a recommendation or solicitation to buy or sell investments.
Issued in EEA by Vanguard Group (Ireland) Limited which is regulated in Ireland by the Central Bank of Ireland.
Issued in Switzerland by Vanguard Investments Switzerland GmbH.
© 2024 Vanguard Group (Ireland) Limited. All rights reserved.
© 2024 Vanguard Investments Switzerland GmbH. All rights reserved.